Immigrants from Trinidad and Tobago vs Belgian In Labor Force | Age 20-24
COMPARE
Immigrants from Trinidad and Tobago
Belgian
In Labor Force | Age 20-24
In Labor Force | Age 20-24 Comparison
Immigrants from Trinidad and Tobago
Belgians
71.1%
IN LABOR FORCE | AGE 20-24
0.0/ 100
METRIC RATING
327th/ 347
METRIC RANK
77.8%
IN LABOR FORCE | AGE 20-24
100.0/ 100
METRIC RATING
28th/ 347
METRIC RANK
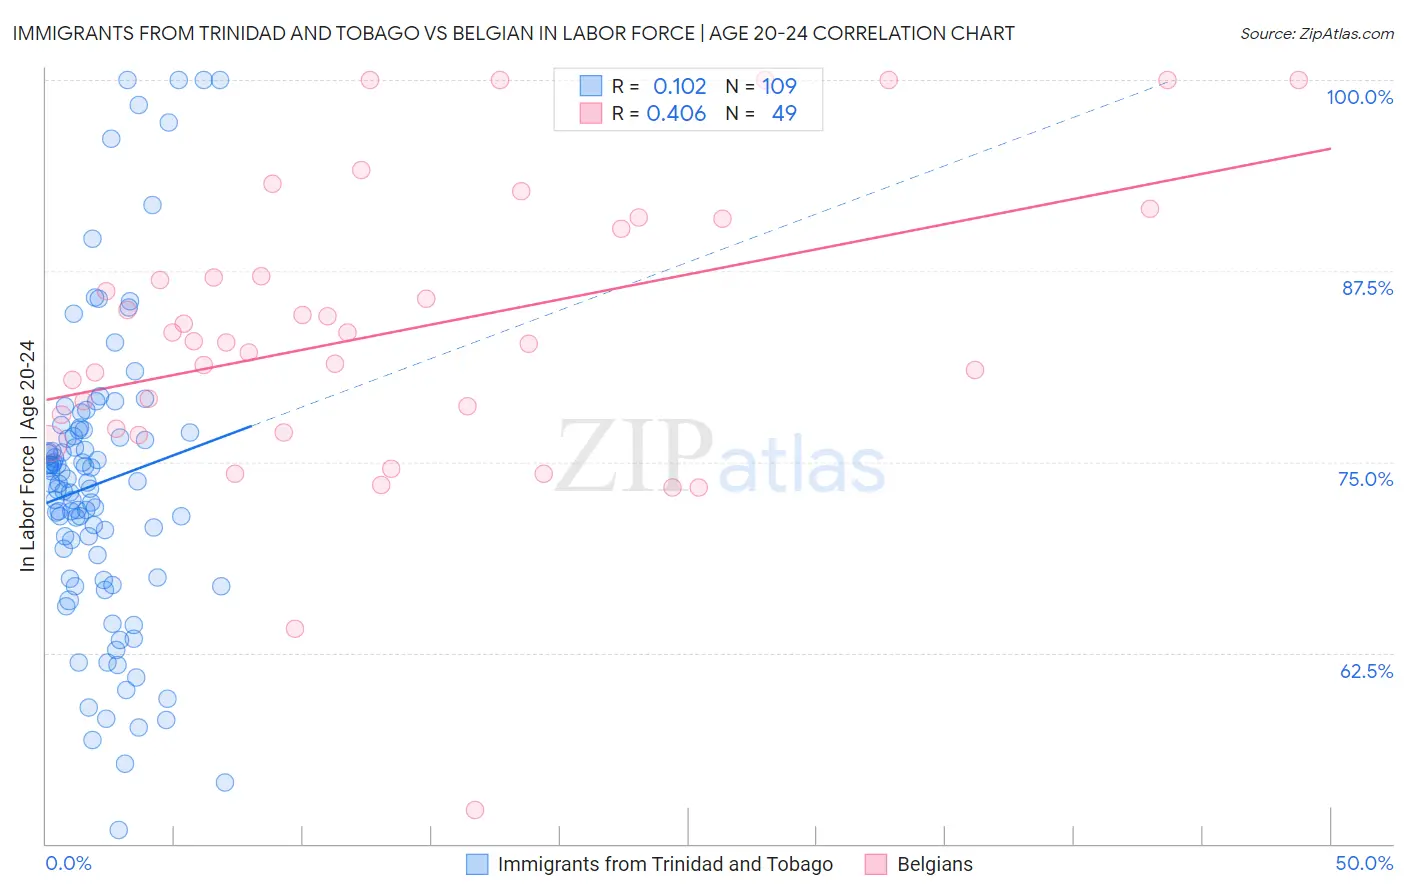
Immigrants from Trinidad and Tobago vs Belgian In Labor Force | Age 20-24 Correlation Chart
The statistical analysis conducted on geographies consisting of 223,471,957 people shows a poor positive correlation between the proportion of Immigrants from Trinidad and Tobago and labor force participation rate among population between the ages 20 and 24 in the United States with a correlation coefficient (R) of 0.102 and weighted average of 71.1%. Similarly, the statistical analysis conducted on geographies consisting of 355,814,007 people shows a moderate positive correlation between the proportion of Belgians and labor force participation rate among population between the ages 20 and 24 in the United States with a correlation coefficient (R) of 0.406 and weighted average of 77.8%, a difference of 9.5%.
In Labor Force | Age 20-24 Correlation Summary
| Measurement | Immigrants from Trinidad and Tobago | Belgian |
| Minimum | 50.9% | 52.2% |
| Maximum | 100.0% | 100.0% |
| Range | 49.1% | 47.8% |
| Mean | 73.6% | 83.6% |
| Median | 73.6% | 82.9% |
| Interquartile 25% (IQ1) | 67.4% | 77.6% |
| Interquartile 75% (IQ3) | 77.0% | 90.6% |
| Interquartile Range (IQR) | 9.6% | 13.0% |
| Standard Deviation (Sample) | 10.0% | 9.6% |
| Standard Deviation (Population) | 9.9% | 9.5% |
Similar Demographics by In Labor Force | Age 20-24
Demographics Similar to Immigrants from Trinidad and Tobago by In Labor Force | Age 20-24
In terms of in labor force | age 20-24, the demographic groups most similar to Immigrants from Trinidad and Tobago are Dominican (71.1%, a difference of 0.0%), Immigrants from China (71.1%, a difference of 0.020%), Barbadian (71.1%, a difference of 0.090%), Immigrants from Dominican Republic (71.2%, a difference of 0.19%), and Yup'ik (70.9%, a difference of 0.26%).
| Demographics | Rating | Rank | In Labor Force | Age 20-24 |
| Trinidadians and Tobagonians | 0.0 /100 | #320 | Tragic 71.5% |
| Immigrants | Taiwan | 0.0 /100 | #321 | Tragic 71.5% |
| Filipinos | 0.0 /100 | #322 | Tragic 71.4% |
| West Indians | 0.0 /100 | #323 | Tragic 71.3% |
| Immigrants | Dominican Republic | 0.0 /100 | #324 | Tragic 71.2% |
| Barbadians | 0.0 /100 | #325 | Tragic 71.1% |
| Dominicans | 0.0 /100 | #326 | Tragic 71.1% |
| Immigrants | Trinidad and Tobago | 0.0 /100 | #327 | Tragic 71.1% |
| Immigrants | China | 0.0 /100 | #328 | Tragic 71.1% |
| Yup'ik | 0.0 /100 | #329 | Tragic 70.9% |
| Vietnamese | 0.0 /100 | #330 | Tragic 70.6% |
| Immigrants | Bangladesh | 0.0 /100 | #331 | Tragic 70.6% |
| Immigrants | Uzbekistan | 0.0 /100 | #332 | Tragic 70.4% |
| Yuman | 0.0 /100 | #333 | Tragic 70.3% |
| British West Indians | 0.0 /100 | #334 | Tragic 70.0% |
Demographics Similar to Belgians by In Labor Force | Age 20-24
In terms of in labor force | age 20-24, the demographic groups most similar to Belgians are Immigrants from Micronesia (77.8%, a difference of 0.040%), Slovak (77.7%, a difference of 0.090%), Swiss (77.7%, a difference of 0.10%), Tongan (77.9%, a difference of 0.16%), and Tlingit-Haida (77.9%, a difference of 0.18%).
| Demographics | Rating | Rank | In Labor Force | Age 20-24 |
| Puget Sound Salish | 100.0 /100 | #21 | Exceptional 78.0% |
| Pennsylvania Germans | 100.0 /100 | #22 | Exceptional 78.0% |
| Yugoslavians | 100.0 /100 | #23 | Exceptional 78.0% |
| Liberians | 100.0 /100 | #24 | Exceptional 78.0% |
| Tlingit-Haida | 100.0 /100 | #25 | Exceptional 77.9% |
| Tongans | 100.0 /100 | #26 | Exceptional 77.9% |
| Immigrants | Micronesia | 100.0 /100 | #27 | Exceptional 77.8% |
| Belgians | 100.0 /100 | #28 | Exceptional 77.8% |
| Slovaks | 100.0 /100 | #29 | Exceptional 77.7% |
| Swiss | 100.0 /100 | #30 | Exceptional 77.7% |
| Poles | 100.0 /100 | #31 | Exceptional 77.6% |
| English | 100.0 /100 | #32 | Exceptional 77.6% |
| Immigrants | Ethiopia | 100.0 /100 | #33 | Exceptional 77.5% |
| German Russians | 100.0 /100 | #34 | Exceptional 77.5% |
| Immigrants | Eastern Africa | 100.0 /100 | #35 | Exceptional 77.5% |