Cuban vs Bolivian In Labor Force | Age 20-24
COMPARE
Cuban
Bolivian
In Labor Force | Age 20-24
In Labor Force | Age 20-24 Comparison
Cubans
Bolivians
72.5%
IN LABOR FORCE | AGE 20-24
0.0/ 100
METRIC RATING
301st/ 347
METRIC RANK
75.2%
IN LABOR FORCE | AGE 20-24
64.0/ 100
METRIC RATING
164th/ 347
METRIC RANK
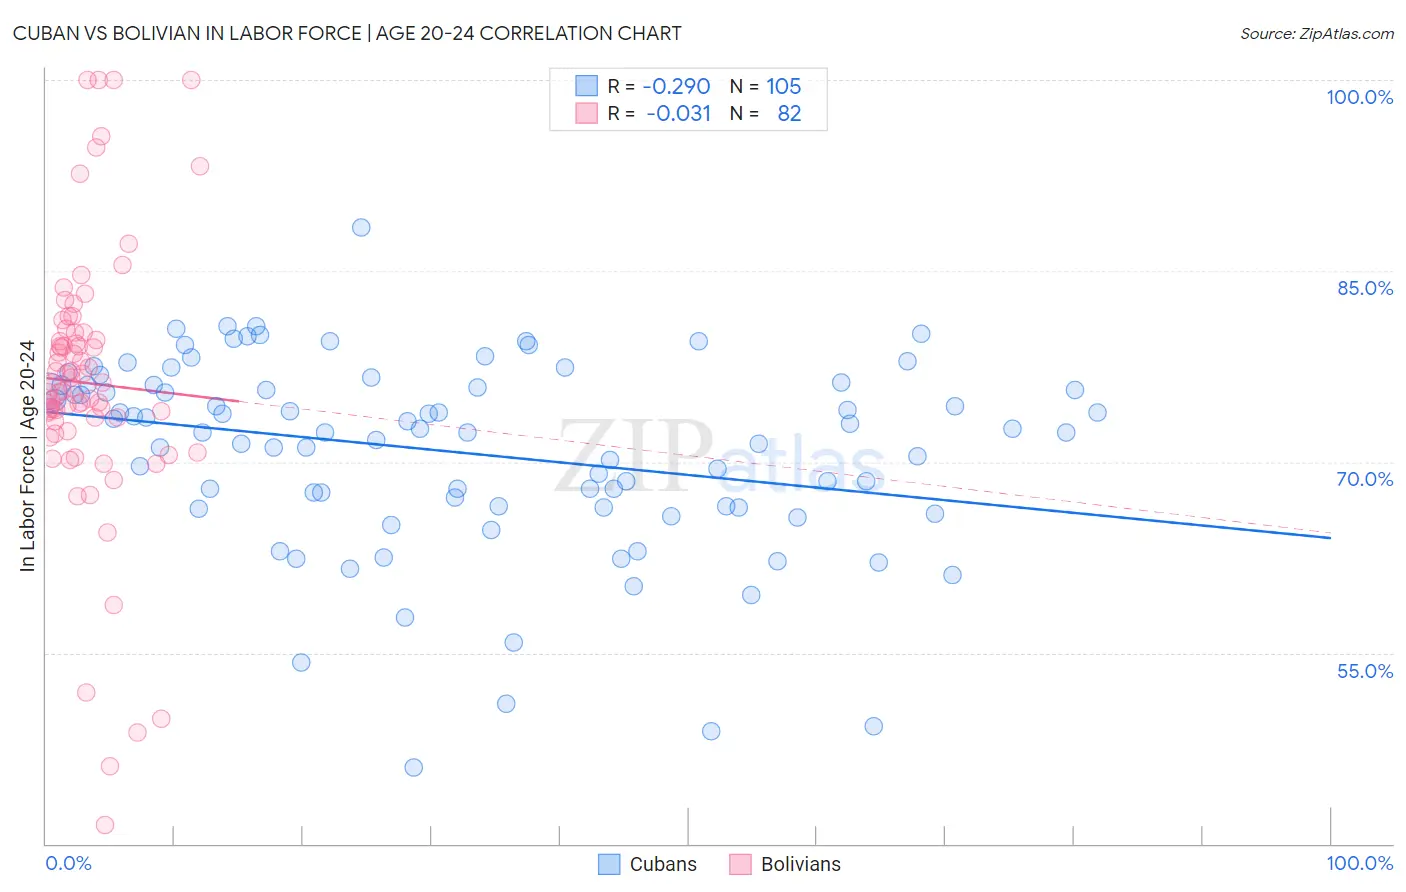
Cuban vs Bolivian In Labor Force | Age 20-24 Correlation Chart
The statistical analysis conducted on geographies consisting of 449,113,848 people shows a weak negative correlation between the proportion of Cubans and labor force participation rate among population between the ages 20 and 24 in the United States with a correlation coefficient (R) of -0.290 and weighted average of 72.5%. Similarly, the statistical analysis conducted on geographies consisting of 184,640,260 people shows no correlation between the proportion of Bolivians and labor force participation rate among population between the ages 20 and 24 in the United States with a correlation coefficient (R) of -0.031 and weighted average of 75.2%, a difference of 3.7%.
In Labor Force | Age 20-24 Correlation Summary
| Measurement | Cuban | Bolivian |
| Minimum | 46.0% | 41.5% |
| Maximum | 88.4% | 100.0% |
| Range | 42.4% | 58.5% |
| Mean | 70.8% | 76.2% |
| Median | 72.4% | 76.0% |
| Interquartile 25% (IQ1) | 66.4% | 73.2% |
| Interquartile 75% (IQ3) | 76.0% | 80.2% |
| Interquartile Range (IQR) | 9.6% | 6.9% |
| Standard Deviation (Sample) | 7.6% | 10.8% |
| Standard Deviation (Population) | 7.6% | 10.7% |
Similar Demographics by In Labor Force | Age 20-24
Demographics Similar to Cubans by In Labor Force | Age 20-24
In terms of in labor force | age 20-24, the demographic groups most similar to Cubans are Armenian (72.5%, a difference of 0.070%), Iranian (72.6%, a difference of 0.090%), Native/Alaskan (72.4%, a difference of 0.090%), Ecuadorian (72.4%, a difference of 0.10%), and Immigrants from West Indies (72.4%, a difference of 0.11%).
| Demographics | Rating | Rank | In Labor Force | Age 20-24 |
| Immigrants | Argentina | 0.0 /100 | #294 | Tragic 72.8% |
| Okinawans | 0.0 /100 | #295 | Tragic 72.7% |
| Jamaicans | 0.0 /100 | #296 | Tragic 72.7% |
| Central American Indians | 0.0 /100 | #297 | Tragic 72.7% |
| Israelis | 0.0 /100 | #298 | Tragic 72.6% |
| Iranians | 0.0 /100 | #299 | Tragic 72.6% |
| Armenians | 0.0 /100 | #300 | Tragic 72.5% |
| Cubans | 0.0 /100 | #301 | Tragic 72.5% |
| Natives/Alaskans | 0.0 /100 | #302 | Tragic 72.4% |
| Ecuadorians | 0.0 /100 | #303 | Tragic 72.4% |
| Immigrants | West Indies | 0.0 /100 | #304 | Tragic 72.4% |
| Immigrants | Singapore | 0.0 /100 | #305 | Tragic 72.4% |
| Immigrants | Jamaica | 0.0 /100 | #306 | Tragic 72.4% |
| Immigrants | Ecuador | 0.0 /100 | #307 | Tragic 72.3% |
| Soviet Union | 0.0 /100 | #308 | Tragic 72.3% |
Demographics Similar to Bolivians by In Labor Force | Age 20-24
In terms of in labor force | age 20-24, the demographic groups most similar to Bolivians are Costa Rican (75.2%, a difference of 0.0%), Immigrants from Romania (75.2%, a difference of 0.010%), Afghan (75.2%, a difference of 0.010%), New Zealander (75.2%, a difference of 0.020%), and Cambodian (75.2%, a difference of 0.050%).
| Demographics | Rating | Rank | In Labor Force | Age 20-24 |
| Immigrants | Western Europe | 71.5 /100 | #157 | Good 75.3% |
| Immigrants | Bolivia | 71.0 /100 | #158 | Good 75.3% |
| South American Indians | 69.0 /100 | #159 | Good 75.3% |
| Japanese | 68.7 /100 | #160 | Good 75.3% |
| New Zealanders | 65.4 /100 | #161 | Good 75.2% |
| Immigrants | Romania | 64.6 /100 | #162 | Good 75.2% |
| Costa Ricans | 64.2 /100 | #163 | Good 75.2% |
| Bolivians | 64.0 /100 | #164 | Good 75.2% |
| Afghans | 63.5 /100 | #165 | Good 75.2% |
| Cambodians | 60.5 /100 | #166 | Good 75.2% |
| Immigrants | South Eastern Asia | 57.5 /100 | #167 | Average 75.1% |
| Immigrants | Western Africa | 56.7 /100 | #168 | Average 75.1% |
| Immigrants | Philippines | 55.8 /100 | #169 | Average 75.1% |
| Mexicans | 52.1 /100 | #170 | Average 75.1% |
| Cajuns | 51.1 /100 | #171 | Average 75.1% |