Cuban vs Belgian Master's Degree
COMPARE
Cuban
Belgian
Master's Degree
Master's Degree Comparison
Cubans
Belgians
12.1%
MASTER'S DEGREE
0.3/ 100
METRIC RATING
275th/ 347
METRIC RANK
14.5%
MASTER'S DEGREE
28.0/ 100
METRIC RATING
197th/ 347
METRIC RANK
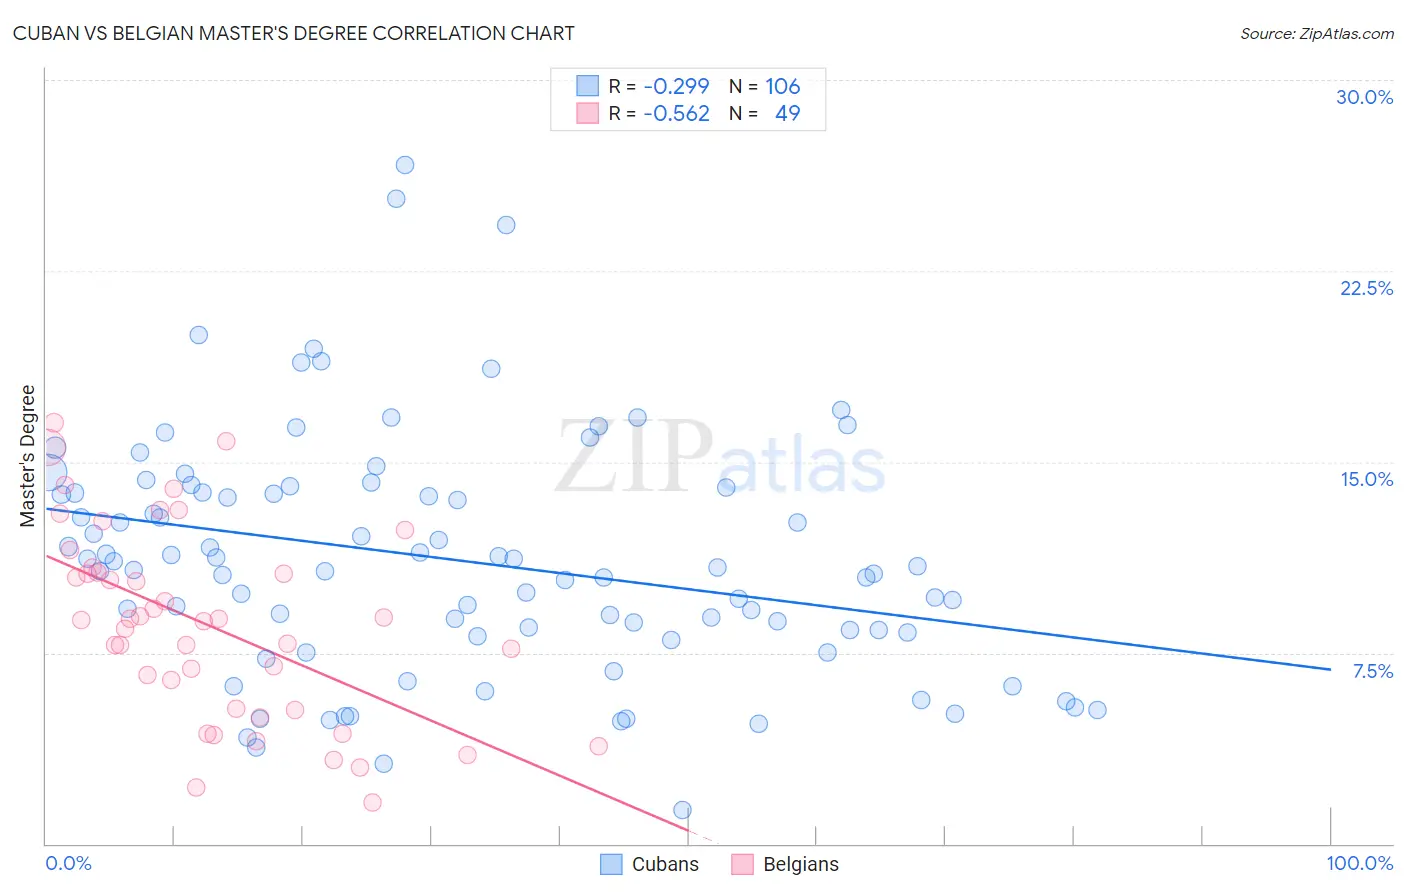
Cuban vs Belgian Master's Degree Correlation Chart
The statistical analysis conducted on geographies consisting of 449,063,887 people shows a weak negative correlation between the proportion of Cubans and percentage of population with at least master's degree education in the United States with a correlation coefficient (R) of -0.299 and weighted average of 12.1%. Similarly, the statistical analysis conducted on geographies consisting of 355,911,624 people shows a substantial negative correlation between the proportion of Belgians and percentage of population with at least master's degree education in the United States with a correlation coefficient (R) of -0.562 and weighted average of 14.5%, a difference of 19.8%.
Master's Degree Correlation Summary
| Measurement | Cuban | Belgian |
| Minimum | 1.3% | 1.6% |
| Maximum | 26.7% | 16.5% |
| Range | 25.4% | 14.9% |
| Mean | 11.1% | 8.6% |
| Median | 10.8% | 8.8% |
| Interquartile 25% (IQ1) | 8.3% | 5.3% |
| Interquartile 75% (IQ3) | 13.8% | 10.7% |
| Interquartile Range (IQR) | 5.5% | 5.5% |
| Standard Deviation (Sample) | 4.7% | 3.8% |
| Standard Deviation (Population) | 4.7% | 3.7% |
Similar Demographics by Master's Degree
Demographics Similar to Cubans by Master's Degree
In terms of master's degree, the demographic groups most similar to Cubans are Cape Verdean (12.1%, a difference of 0.020%), Black/African American (12.1%, a difference of 0.050%), Immigrants from Caribbean (12.1%, a difference of 0.060%), Potawatomi (12.1%, a difference of 0.070%), and Blackfeet (12.1%, a difference of 0.10%).
| Demographics | Rating | Rank | Master's Degree |
| Native Hawaiians | 0.4 /100 | #268 | Tragic 12.3% |
| Central Americans | 0.3 /100 | #269 | Tragic 12.2% |
| Salvadorans | 0.3 /100 | #270 | Tragic 12.2% |
| Haitians | 0.3 /100 | #271 | Tragic 12.1% |
| Comanche | 0.3 /100 | #272 | Tragic 12.1% |
| Blackfeet | 0.3 /100 | #273 | Tragic 12.1% |
| Cape Verdeans | 0.3 /100 | #274 | Tragic 12.1% |
| Cubans | 0.3 /100 | #275 | Tragic 12.1% |
| Blacks/African Americans | 0.3 /100 | #276 | Tragic 12.1% |
| Immigrants | Caribbean | 0.3 /100 | #277 | Tragic 12.1% |
| Potawatomi | 0.3 /100 | #278 | Tragic 12.1% |
| Immigrants | Belize | 0.2 /100 | #279 | Tragic 12.1% |
| Immigrants | Dominican Republic | 0.2 /100 | #280 | Tragic 12.1% |
| Malaysians | 0.2 /100 | #281 | Tragic 12.0% |
| Immigrants | El Salvador | 0.2 /100 | #282 | Tragic 12.0% |
Demographics Similar to Belgians by Master's Degree
In terms of master's degree, the demographic groups most similar to Belgians are West Indian (14.5%, a difference of 0.10%), Immigrants from Armenia (14.5%, a difference of 0.14%), Czechoslovakian (14.5%, a difference of 0.31%), Panamanian (14.4%, a difference of 0.50%), and Scotch-Irish (14.4%, a difference of 0.51%).
| Demographics | Rating | Rank | Master's Degree |
| Spaniards | 35.8 /100 | #190 | Fair 14.6% |
| Welsh | 34.2 /100 | #191 | Fair 14.6% |
| Immigrants | Middle Africa | 33.6 /100 | #192 | Fair 14.6% |
| Immigrants | Nigeria | 32.7 /100 | #193 | Fair 14.6% |
| Chinese | 32.5 /100 | #194 | Fair 14.6% |
| Danes | 31.3 /100 | #195 | Fair 14.5% |
| Czechoslovakians | 29.9 /100 | #196 | Fair 14.5% |
| Belgians | 28.0 /100 | #197 | Fair 14.5% |
| West Indians | 27.4 /100 | #198 | Fair 14.5% |
| Immigrants | Armenia | 27.2 /100 | #199 | Fair 14.5% |
| Panamanians | 25.1 /100 | #200 | Fair 14.4% |
| Scotch-Irish | 25.0 /100 | #201 | Fair 14.4% |
| Immigrants | Western Africa | 24.9 /100 | #202 | Fair 14.4% |
| Yugoslavians | 24.3 /100 | #203 | Fair 14.4% |
| French | 23.7 /100 | #204 | Fair 14.4% |