Crow vs Immigrants from Morocco Seniors Poverty Over the Age of 75
COMPARE
Crow
Immigrants from Morocco
Seniors Poverty Over the Age of 75
Seniors Poverty Over the Age of 75 Comparison
Crow
Immigrants from Morocco
15.9%
SENIORS POVERTY OVER THE AGE OF 75
0.0/ 100
METRIC RATING
312th/ 347
METRIC RANK
13.1%
SENIORS POVERTY OVER THE AGE OF 75
2.8/ 100
METRIC RATING
225th/ 347
METRIC RANK
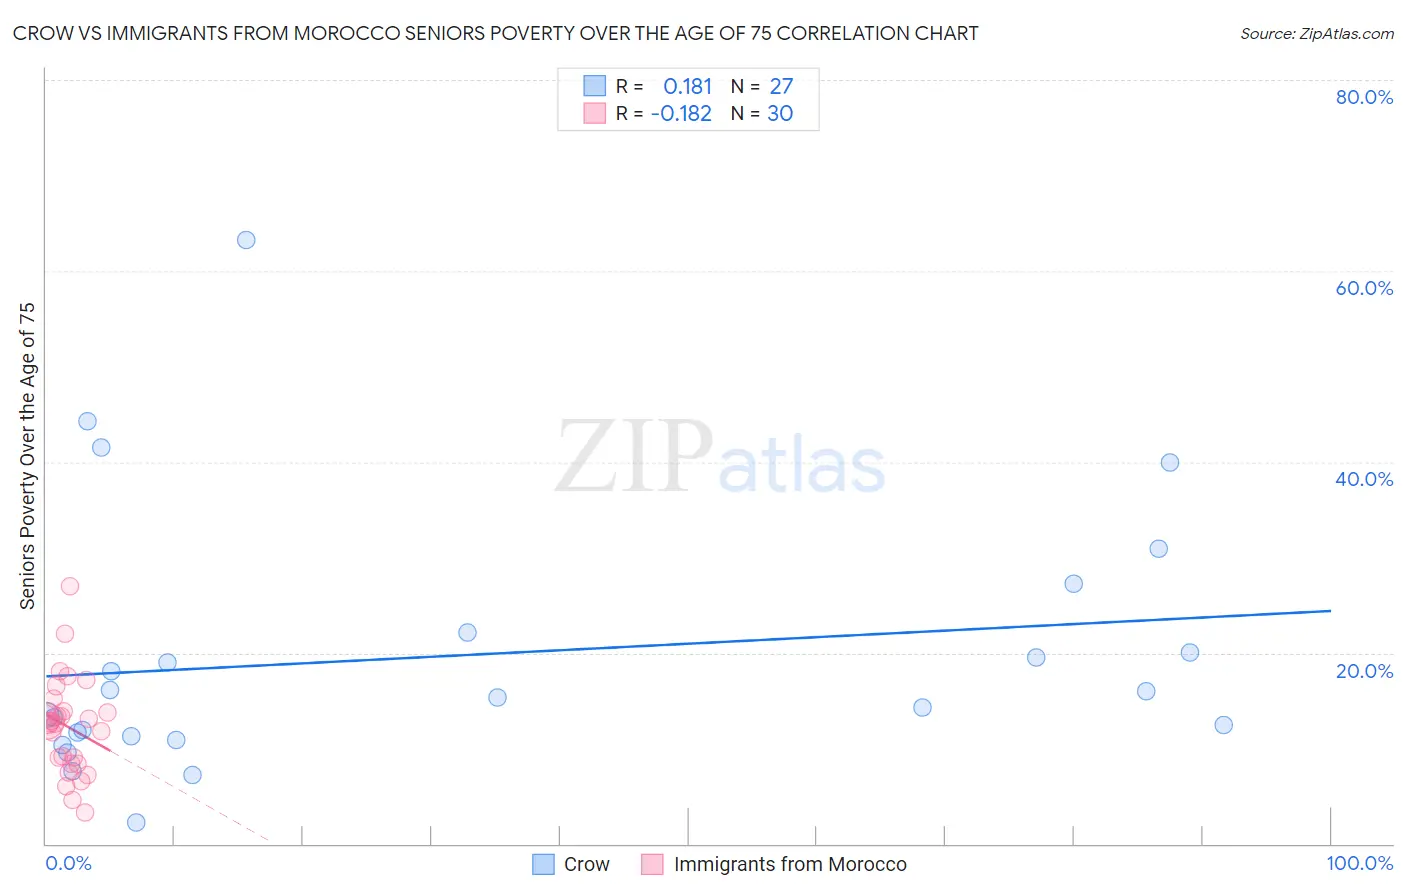
Crow vs Immigrants from Morocco Seniors Poverty Over the Age of 75 Correlation Chart
The statistical analysis conducted on geographies consisting of 58,947,142 people shows a poor positive correlation between the proportion of Crow and poverty level among seniors over the age of 75 in the United States with a correlation coefficient (R) of 0.181 and weighted average of 15.9%. Similarly, the statistical analysis conducted on geographies consisting of 178,230,696 people shows a poor negative correlation between the proportion of Immigrants from Morocco and poverty level among seniors over the age of 75 in the United States with a correlation coefficient (R) of -0.182 and weighted average of 13.1%, a difference of 22.0%.
Seniors Poverty Over the Age of 75 Correlation Summary
| Measurement | Crow | Immigrants from Morocco |
| Minimum | 2.2% | 3.2% |
| Maximum | 63.2% | 26.9% |
| Range | 61.0% | 23.7% |
| Mean | 19.6% | 12.2% |
| Median | 15.3% | 12.6% |
| Interquartile 25% (IQ1) | 11.2% | 8.4% |
| Interquartile 75% (IQ3) | 22.1% | 13.8% |
| Interquartile Range (IQR) | 10.9% | 5.4% |
| Standard Deviation (Sample) | 13.7% | 5.1% |
| Standard Deviation (Population) | 13.4% | 5.0% |
Similar Demographics by Seniors Poverty Over the Age of 75
Demographics Similar to Crow by Seniors Poverty Over the Age of 75
In terms of seniors poverty over the age of 75, the demographic groups most similar to Crow are Trinidadian and Tobagonian (15.9%, a difference of 0.41%), Barbadian (16.0%, a difference of 0.47%), Vietnamese (15.9%, a difference of 0.51%), Yup'ik (15.8%, a difference of 0.61%), and Tsimshian (16.1%, a difference of 0.83%).
| Demographics | Rating | Rank | Seniors Poverty Over the Age of 75 |
| Ecuadorians | 0.0 /100 | #305 | Tragic 15.7% |
| Hispanics or Latinos | 0.0 /100 | #306 | Tragic 15.8% |
| Immigrants | West Indies | 0.0 /100 | #307 | Tragic 15.8% |
| Immigrants | Bangladesh | 0.0 /100 | #308 | Tragic 15.8% |
| Yup'ik | 0.0 /100 | #309 | Tragic 15.8% |
| Vietnamese | 0.0 /100 | #310 | Tragic 15.9% |
| Trinidadians and Tobagonians | 0.0 /100 | #311 | Tragic 15.9% |
| Crow | 0.0 /100 | #312 | Tragic 15.9% |
| Barbadians | 0.0 /100 | #313 | Tragic 16.0% |
| Tsimshian | 0.0 /100 | #314 | Tragic 16.1% |
| Guyanese | 0.0 /100 | #315 | Tragic 16.1% |
| Immigrants | Ecuador | 0.0 /100 | #316 | Tragic 16.1% |
| Immigrants | Guyana | 0.0 /100 | #317 | Tragic 16.2% |
| Houma | 0.0 /100 | #318 | Tragic 16.2% |
| Haitians | 0.0 /100 | #319 | Tragic 16.2% |
Demographics Similar to Immigrants from Morocco by Seniors Poverty Over the Age of 75
In terms of seniors poverty over the age of 75, the demographic groups most similar to Immigrants from Morocco are Chippewa (13.1%, a difference of 0.070%), Shoshone (13.1%, a difference of 0.16%), Immigrants from Nigeria (13.0%, a difference of 0.27%), Nigerian (13.0%, a difference of 0.36%), and Cree (13.1%, a difference of 0.42%).
| Demographics | Rating | Rank | Seniors Poverty Over the Age of 75 |
| Immigrants | Western Asia | 4.9 /100 | #218 | Tragic 12.9% |
| Ute | 4.7 /100 | #219 | Tragic 12.9% |
| Seminole | 4.5 /100 | #220 | Tragic 12.9% |
| Immigrants | Kazakhstan | 4.3 /100 | #221 | Tragic 13.0% |
| Nigerians | 3.4 /100 | #222 | Tragic 13.0% |
| Immigrants | Nigeria | 3.3 /100 | #223 | Tragic 13.0% |
| Chippewa | 2.9 /100 | #224 | Tragic 13.1% |
| Immigrants | Morocco | 2.8 /100 | #225 | Tragic 13.1% |
| Shoshone | 2.6 /100 | #226 | Tragic 13.1% |
| Cree | 2.3 /100 | #227 | Tragic 13.1% |
| Israelis | 2.0 /100 | #228 | Tragic 13.2% |
| Somalis | 1.6 /100 | #229 | Tragic 13.2% |
| Immigrants | China | 1.5 /100 | #230 | Tragic 13.2% |
| Sub-Saharan Africans | 1.5 /100 | #231 | Tragic 13.2% |
| Immigrants | Chile | 1.3 /100 | #232 | Tragic 13.3% |