Croatian vs Immigrants from Africa In Labor Force | Age 25-29
COMPARE
Croatian
Immigrants from Africa
In Labor Force | Age 25-29
In Labor Force | Age 25-29 Comparison
Croatians
Immigrants from Africa
85.8%
IN LABOR FORCE | AGE 25-29
99.9/ 100
METRIC RATING
39th/ 347
METRIC RANK
85.2%
IN LABOR FORCE | AGE 25-29
96.7/ 100
METRIC RATING
85th/ 347
METRIC RANK
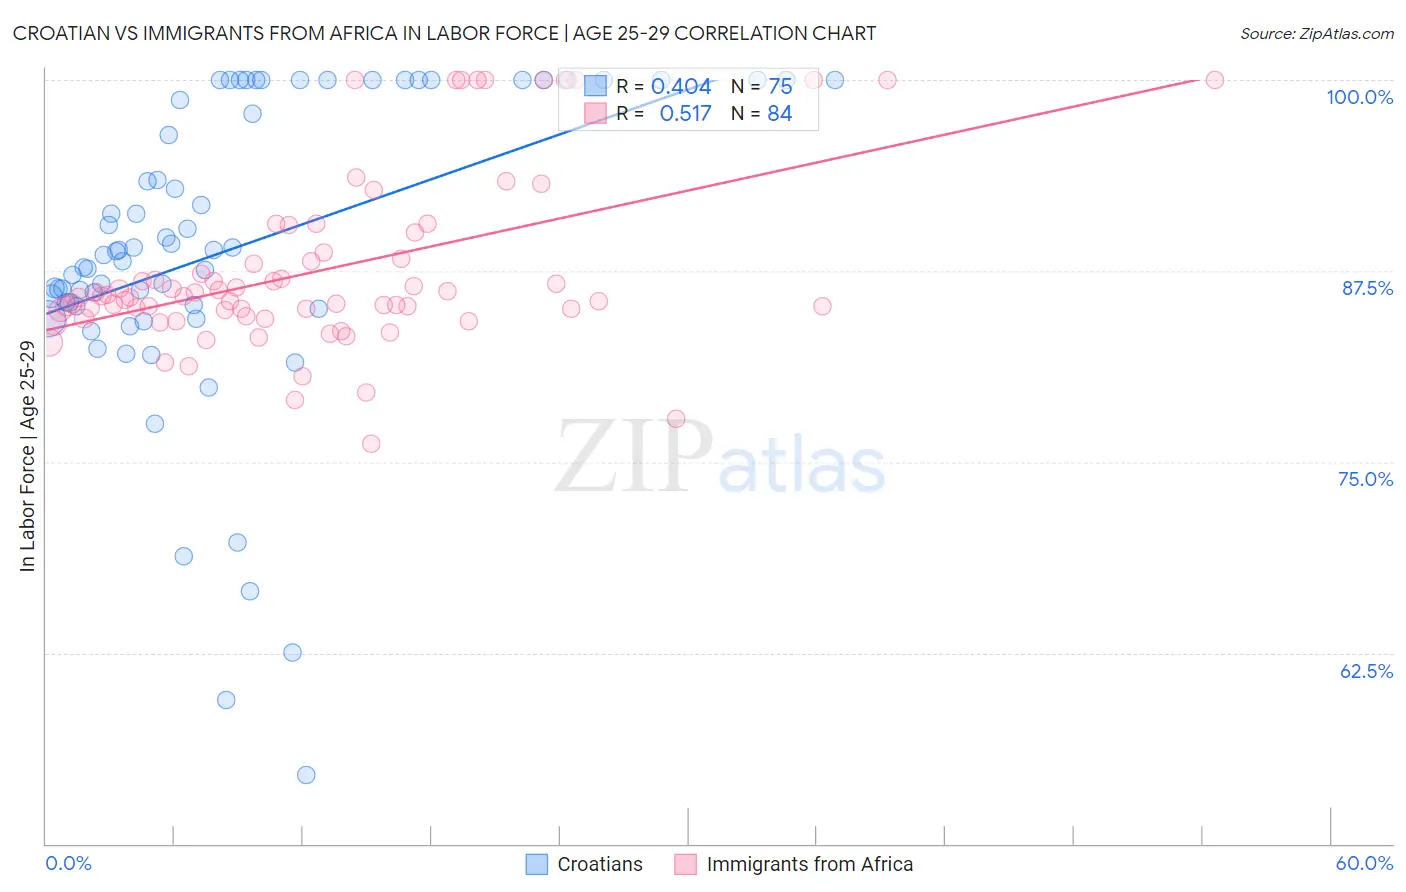
Croatian vs Immigrants from Africa In Labor Force | Age 25-29 Correlation Chart
The statistical analysis conducted on geographies consisting of 375,575,461 people shows a moderate positive correlation between the proportion of Croatians and labor force participation rate among population between the ages 25 and 29 in the United States with a correlation coefficient (R) of 0.404 and weighted average of 85.8%. Similarly, the statistical analysis conducted on geographies consisting of 469,196,939 people shows a substantial positive correlation between the proportion of Immigrants from Africa and labor force participation rate among population between the ages 25 and 29 in the United States with a correlation coefficient (R) of 0.517 and weighted average of 85.2%, a difference of 0.67%.
In Labor Force | Age 25-29 Correlation Summary
| Measurement | Croatian | Immigrants from Africa |
| Minimum | 54.5% | 76.2% |
| Maximum | 100.0% | 100.0% |
| Range | 45.5% | 23.8% |
| Mean | 88.9% | 87.5% |
| Median | 88.8% | 85.8% |
| Interquartile 25% (IQ1) | 85.2% | 84.7% |
| Interquartile 75% (IQ3) | 100.0% | 88.5% |
| Interquartile Range (IQR) | 14.8% | 3.8% |
| Standard Deviation (Sample) | 10.0% | 5.7% |
| Standard Deviation (Population) | 10.0% | 5.7% |
Similar Demographics by In Labor Force | Age 25-29
Demographics Similar to Croatians by In Labor Force | Age 25-29
In terms of in labor force | age 25-29, the demographic groups most similar to Croatians are Sierra Leonean (85.8%, a difference of 0.0%), Immigrants from Albania (85.7%, a difference of 0.020%), Polish (85.8%, a difference of 0.030%), Immigrants from Greece (85.7%, a difference of 0.030%), and Immigrants from Nepal (85.8%, a difference of 0.050%).
| Demographics | Rating | Rank | In Labor Force | Age 25-29 |
| Slovaks | 100.0 /100 | #32 | Exceptional 85.8% |
| Immigrants | Bulgaria | 100.0 /100 | #33 | Exceptional 85.8% |
| Lithuanians | 99.9 /100 | #34 | Exceptional 85.8% |
| Cypriots | 99.9 /100 | #35 | Exceptional 85.8% |
| Immigrants | Nepal | 99.9 /100 | #36 | Exceptional 85.8% |
| Poles | 99.9 /100 | #37 | Exceptional 85.8% |
| Sierra Leoneans | 99.9 /100 | #38 | Exceptional 85.8% |
| Croatians | 99.9 /100 | #39 | Exceptional 85.8% |
| Immigrants | Albania | 99.9 /100 | #40 | Exceptional 85.7% |
| Immigrants | Greece | 99.9 /100 | #41 | Exceptional 85.7% |
| Immigrants | Eritrea | 99.9 /100 | #42 | Exceptional 85.7% |
| Immigrants | India | 99.9 /100 | #43 | Exceptional 85.7% |
| Macedonians | 99.9 /100 | #44 | Exceptional 85.7% |
| Immigrants | Sierra Leone | 99.9 /100 | #45 | Exceptional 85.7% |
| Czechs | 99.8 /100 | #46 | Exceptional 85.6% |
Demographics Similar to Immigrants from Africa by In Labor Force | Age 25-29
In terms of in labor force | age 25-29, the demographic groups most similar to Immigrants from Africa are Immigrants from Eastern Europe (85.2%, a difference of 0.0%), Ukrainian (85.2%, a difference of 0.0%), Okinawan (85.2%, a difference of 0.010%), Immigrants from Europe (85.2%, a difference of 0.010%), and French Canadian (85.2%, a difference of 0.010%).
| Demographics | Rating | Rank | In Labor Force | Age 25-29 |
| Immigrants | Egypt | 97.7 /100 | #78 | Exceptional 85.2% |
| Immigrants | Northern Africa | 97.6 /100 | #79 | Exceptional 85.2% |
| Immigrants | Zimbabwe | 97.6 /100 | #80 | Exceptional 85.2% |
| Immigrants | Northern Europe | 97.2 /100 | #81 | Exceptional 85.2% |
| Okinawans | 97.0 /100 | #82 | Exceptional 85.2% |
| Immigrants | Europe | 96.8 /100 | #83 | Exceptional 85.2% |
| Immigrants | Eastern Europe | 96.8 /100 | #84 | Exceptional 85.2% |
| Immigrants | Africa | 96.7 /100 | #85 | Exceptional 85.2% |
| Ukrainians | 96.7 /100 | #86 | Exceptional 85.2% |
| French Canadians | 96.5 /100 | #87 | Exceptional 85.2% |
| Immigrants | Croatia | 96.4 /100 | #88 | Exceptional 85.2% |
| Immigrants | France | 96.3 /100 | #89 | Exceptional 85.2% |
| Burmese | 95.9 /100 | #90 | Exceptional 85.1% |
| Immigrants | Moldova | 95.8 /100 | #91 | Exceptional 85.1% |
| Immigrants | Costa Rica | 95.5 /100 | #92 | Exceptional 85.1% |