South African vs Immigrants from Nigeria In Labor Force | Age 45-54
COMPARE
South African
Immigrants from Nigeria
In Labor Force | Age 45-54
In Labor Force | Age 45-54 Comparison
South Africans
Immigrants from Nigeria
82.6%
IN LABOR FORCE | AGE 45-54
28.0/ 100
METRIC RATING
188th/ 347
METRIC RANK
83.0%
IN LABOR FORCE | AGE 45-54
74.1/ 100
METRIC RATING
148th/ 347
METRIC RANK
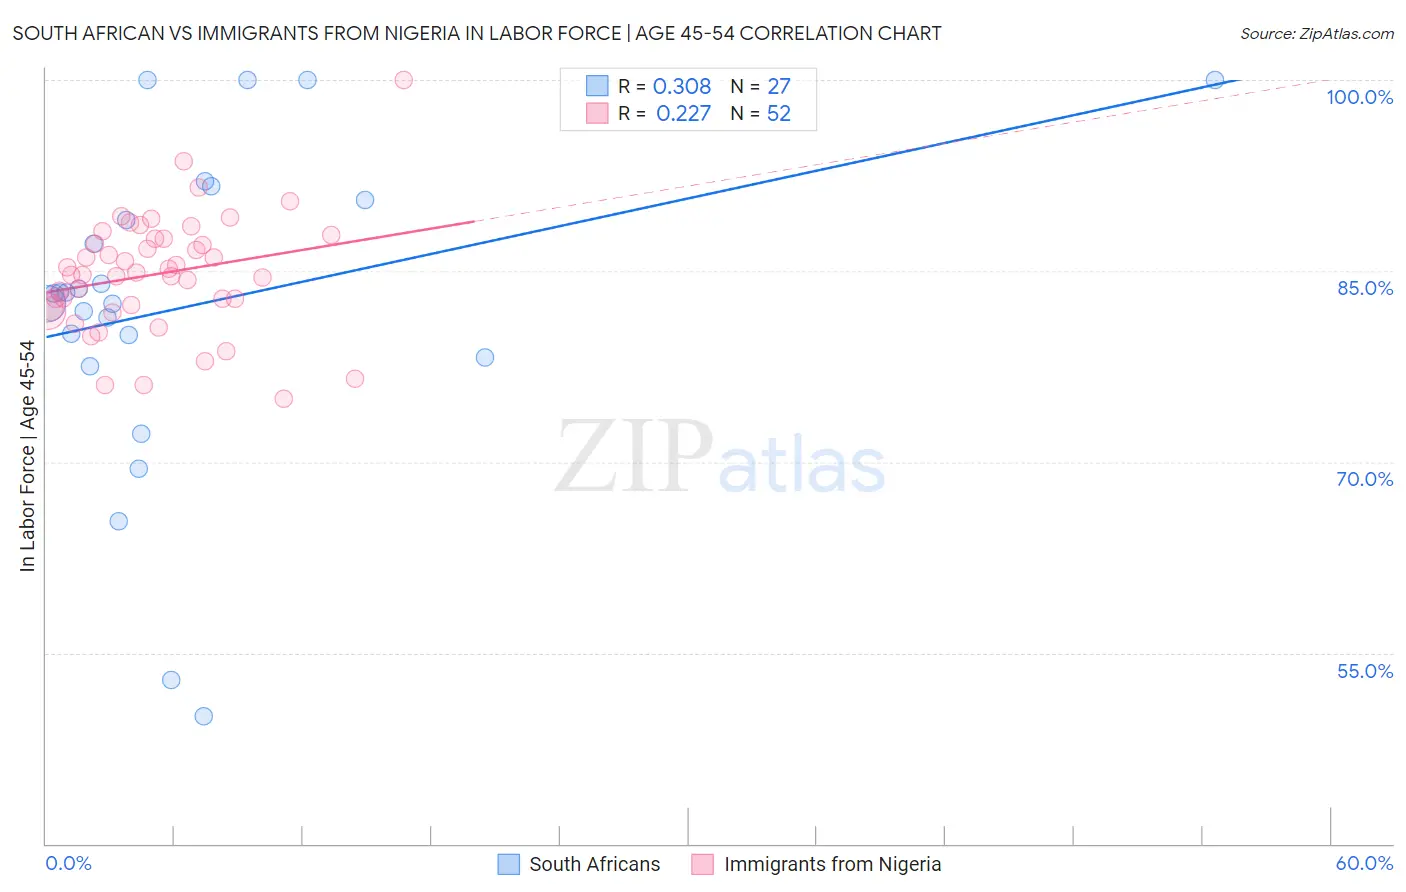
South African vs Immigrants from Nigeria In Labor Force | Age 45-54 Correlation Chart
The statistical analysis conducted on geographies consisting of 182,539,352 people shows a mild positive correlation between the proportion of South Africans and labor force participation rate among population between the ages 45 and 54 in the United States with a correlation coefficient (R) of 0.308 and weighted average of 82.6%. Similarly, the statistical analysis conducted on geographies consisting of 283,287,443 people shows a weak positive correlation between the proportion of Immigrants from Nigeria and labor force participation rate among population between the ages 45 and 54 in the United States with a correlation coefficient (R) of 0.227 and weighted average of 83.0%, a difference of 0.44%.
In Labor Force | Age 45-54 Correlation Summary
| Measurement | South African | Immigrants from Nigeria |
| Minimum | 50.0% | 75.0% |
| Maximum | 100.0% | 100.0% |
| Range | 50.0% | 25.0% |
| Mean | 82.3% | 84.8% |
| Median | 83.2% | 84.8% |
| Interquartile 25% (IQ1) | 78.2% | 82.2% |
| Interquartile 75% (IQ3) | 90.6% | 87.5% |
| Interquartile Range (IQR) | 12.4% | 5.3% |
| Standard Deviation (Sample) | 12.5% | 4.6% |
| Standard Deviation (Population) | 12.3% | 4.6% |
Similar Demographics by In Labor Force | Age 45-54
Demographics Similar to South Africans by In Labor Force | Age 45-54
In terms of in labor force | age 45-54, the demographic groups most similar to South Africans are Immigrants from Costa Rica (82.6%, a difference of 0.0%), Irish (82.6%, a difference of 0.010%), Syrian (82.6%, a difference of 0.020%), British (82.6%, a difference of 0.030%), and Immigrants from England (82.6%, a difference of 0.040%).
| Demographics | Rating | Rank | In Labor Force | Age 45-54 |
| Israelis | 37.7 /100 | #181 | Fair 82.7% |
| Immigrants | Hungary | 37.1 /100 | #182 | Fair 82.7% |
| New Zealanders | 32.7 /100 | #183 | Fair 82.6% |
| Europeans | 32.6 /100 | #184 | Fair 82.6% |
| Immigrants | England | 32.2 /100 | #185 | Fair 82.6% |
| Irish | 29.2 /100 | #186 | Fair 82.6% |
| Immigrants | Costa Rica | 28.3 /100 | #187 | Fair 82.6% |
| South Africans | 28.0 /100 | #188 | Fair 82.6% |
| Syrians | 26.0 /100 | #189 | Fair 82.6% |
| British | 25.7 /100 | #190 | Fair 82.6% |
| Armenians | 23.2 /100 | #191 | Fair 82.5% |
| Immigrants | Iraq | 20.9 /100 | #192 | Fair 82.5% |
| Australians | 20.8 /100 | #193 | Fair 82.5% |
| Immigrants | Norway | 20.7 /100 | #194 | Fair 82.5% |
| Immigrants | Canada | 20.0 /100 | #195 | Fair 82.5% |
Demographics Similar to Immigrants from Nigeria by In Labor Force | Age 45-54
In terms of in labor force | age 45-54, the demographic groups most similar to Immigrants from Nigeria are Immigrants from France (83.0%, a difference of 0.010%), Czechoslovakian (83.0%, a difference of 0.010%), Immigrants from Sweden (82.9%, a difference of 0.010%), Romanian (83.0%, a difference of 0.020%), and Immigrants from Netherlands (82.9%, a difference of 0.020%).
| Demographics | Rating | Rank | In Labor Force | Age 45-54 |
| Immigrants | Haiti | 77.9 /100 | #141 | Good 83.0% |
| Immigrants | Scotland | 77.8 /100 | #142 | Good 83.0% |
| Okinawans | 77.0 /100 | #143 | Good 83.0% |
| Soviet Union | 76.8 /100 | #144 | Good 83.0% |
| Romanians | 75.4 /100 | #145 | Good 83.0% |
| Immigrants | France | 75.3 /100 | #146 | Good 83.0% |
| Czechoslovakians | 74.8 /100 | #147 | Good 83.0% |
| Immigrants | Nigeria | 74.1 /100 | #148 | Good 83.0% |
| Immigrants | Sweden | 73.3 /100 | #149 | Good 82.9% |
| Immigrants | Netherlands | 72.6 /100 | #150 | Good 82.9% |
| Koreans | 71.9 /100 | #151 | Good 82.9% |
| Slavs | 71.5 /100 | #152 | Good 82.9% |
| Immigrants | Indonesia | 70.6 /100 | #153 | Good 82.9% |
| Immigrants | Ghana | 70.3 /100 | #154 | Good 82.9% |
| Immigrants | Philippines | 69.0 /100 | #155 | Good 82.9% |