Immigrants from Africa vs Immigrants from Nigeria In Labor Force | Age 45-54
COMPARE
Immigrants from Africa
Immigrants from Nigeria
In Labor Force | Age 45-54
In Labor Force | Age 45-54 Comparison
Immigrants from Africa
Immigrants from Nigeria
83.2%
IN LABOR FORCE | AGE 45-54
92.6/ 100
METRIC RATING
110th/ 347
METRIC RANK
83.0%
IN LABOR FORCE | AGE 45-54
74.1/ 100
METRIC RATING
148th/ 347
METRIC RANK
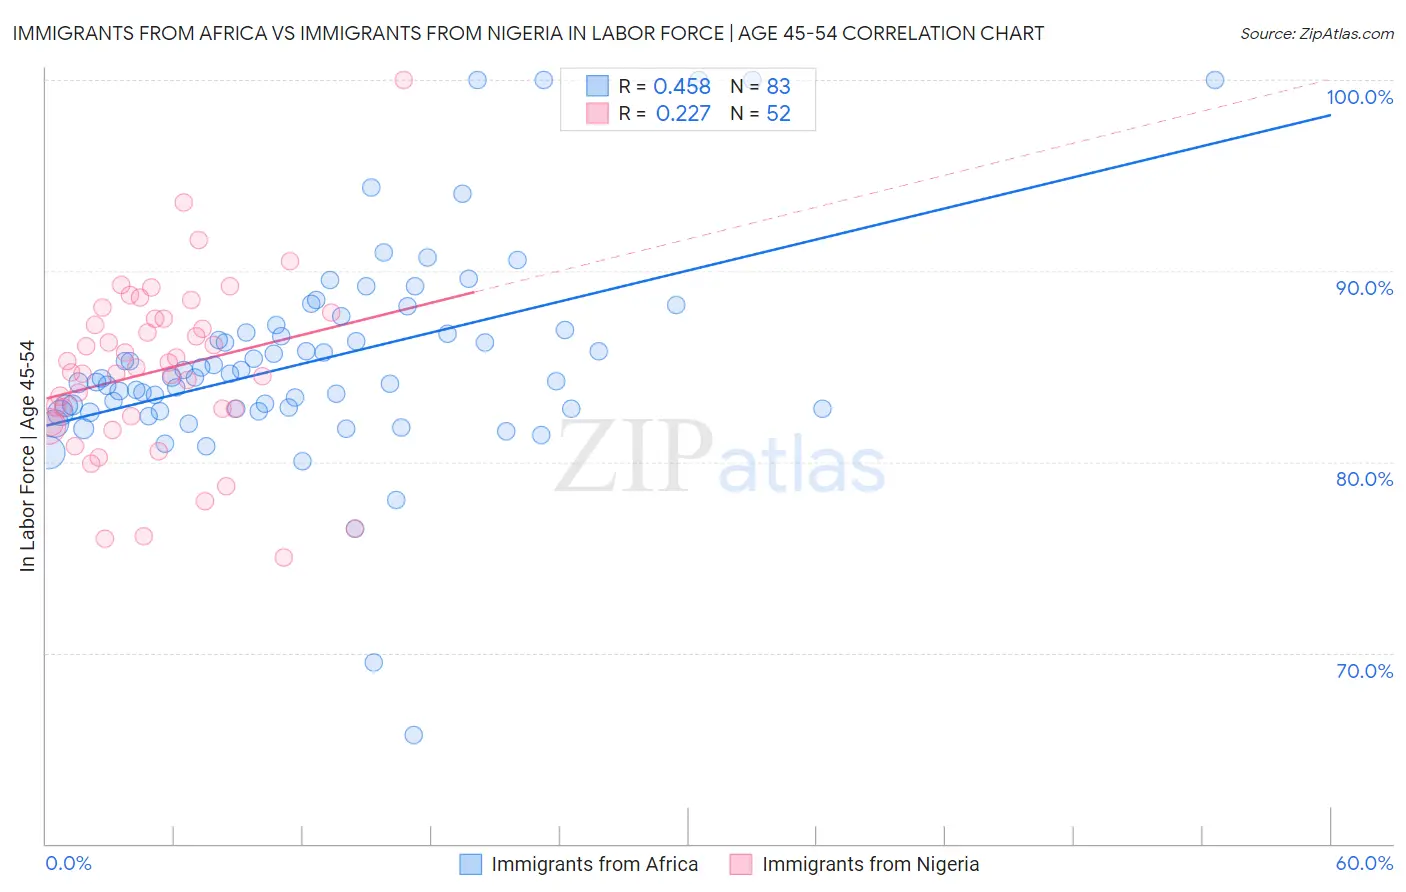
Immigrants from Africa vs Immigrants from Nigeria In Labor Force | Age 45-54 Correlation Chart
The statistical analysis conducted on geographies consisting of 468,907,137 people shows a moderate positive correlation between the proportion of Immigrants from Africa and labor force participation rate among population between the ages 45 and 54 in the United States with a correlation coefficient (R) of 0.458 and weighted average of 83.2%. Similarly, the statistical analysis conducted on geographies consisting of 283,287,443 people shows a weak positive correlation between the proportion of Immigrants from Nigeria and labor force participation rate among population between the ages 45 and 54 in the United States with a correlation coefficient (R) of 0.227 and weighted average of 83.0%, a difference of 0.33%.
In Labor Force | Age 45-54 Correlation Summary
| Measurement | Immigrants from Africa | Immigrants from Nigeria |
| Minimum | 65.7% | 75.0% |
| Maximum | 100.0% | 100.0% |
| Range | 34.3% | 25.0% |
| Mean | 85.3% | 84.8% |
| Median | 84.4% | 84.8% |
| Interquartile 25% (IQ1) | 82.8% | 82.2% |
| Interquartile 75% (IQ3) | 86.9% | 87.5% |
| Interquartile Range (IQR) | 4.1% | 5.3% |
| Standard Deviation (Sample) | 5.5% | 4.6% |
| Standard Deviation (Population) | 5.5% | 4.6% |
Similar Demographics by In Labor Force | Age 45-54
Demographics Similar to Immigrants from Africa by In Labor Force | Age 45-54
In terms of in labor force | age 45-54, the demographic groups most similar to Immigrants from Africa are Slovak (83.2%, a difference of 0.0%), Ukrainian (83.2%, a difference of 0.0%), Immigrants from Italy (83.2%, a difference of 0.0%), Iranian (83.2%, a difference of 0.010%), and Immigrants from Afghanistan (83.2%, a difference of 0.010%).
| Demographics | Rating | Rank | In Labor Force | Age 45-54 |
| Albanians | 93.9 /100 | #103 | Exceptional 83.3% |
| Immigrants | Romania | 93.8 /100 | #104 | Exceptional 83.3% |
| Immigrants | South America | 93.5 /100 | #105 | Exceptional 83.2% |
| Sri Lankans | 93.2 /100 | #106 | Exceptional 83.2% |
| Iranians | 92.9 /100 | #107 | Exceptional 83.2% |
| Slovaks | 92.8 /100 | #108 | Exceptional 83.2% |
| Ukrainians | 92.7 /100 | #109 | Exceptional 83.2% |
| Immigrants | Africa | 92.6 /100 | #110 | Exceptional 83.2% |
| Immigrants | Italy | 92.5 /100 | #111 | Exceptional 83.2% |
| Immigrants | Afghanistan | 92.4 /100 | #112 | Exceptional 83.2% |
| Immigrants | Albania | 91.8 /100 | #113 | Exceptional 83.2% |
| Assyrians/Chaldeans/Syriacs | 91.7 /100 | #114 | Exceptional 83.2% |
| Immigrants | Chile | 91.6 /100 | #115 | Exceptional 83.2% |
| Immigrants | Malaysia | 91.4 /100 | #116 | Exceptional 83.2% |
| Immigrants | China | 90.9 /100 | #117 | Exceptional 83.2% |
Demographics Similar to Immigrants from Nigeria by In Labor Force | Age 45-54
In terms of in labor force | age 45-54, the demographic groups most similar to Immigrants from Nigeria are Immigrants from France (83.0%, a difference of 0.010%), Czechoslovakian (83.0%, a difference of 0.010%), Immigrants from Sweden (82.9%, a difference of 0.010%), Romanian (83.0%, a difference of 0.020%), and Immigrants from Netherlands (82.9%, a difference of 0.020%).
| Demographics | Rating | Rank | In Labor Force | Age 45-54 |
| Immigrants | Haiti | 77.9 /100 | #141 | Good 83.0% |
| Immigrants | Scotland | 77.8 /100 | #142 | Good 83.0% |
| Okinawans | 77.0 /100 | #143 | Good 83.0% |
| Soviet Union | 76.8 /100 | #144 | Good 83.0% |
| Romanians | 75.4 /100 | #145 | Good 83.0% |
| Immigrants | France | 75.3 /100 | #146 | Good 83.0% |
| Czechoslovakians | 74.8 /100 | #147 | Good 83.0% |
| Immigrants | Nigeria | 74.1 /100 | #148 | Good 83.0% |
| Immigrants | Sweden | 73.3 /100 | #149 | Good 82.9% |
| Immigrants | Netherlands | 72.6 /100 | #150 | Good 82.9% |
| Koreans | 71.9 /100 | #151 | Good 82.9% |
| Slavs | 71.5 /100 | #152 | Good 82.9% |
| Immigrants | Indonesia | 70.6 /100 | #153 | Good 82.9% |
| Immigrants | Ghana | 70.3 /100 | #154 | Good 82.9% |
| Immigrants | Philippines | 69.0 /100 | #155 | Good 82.9% |