Creek vs Basque Master's Degree
COMPARE
Creek
Basque
Master's Degree
Master's Degree Comparison
Creek
Basques
10.5%
MASTER'S DEGREE
0.0/ 100
METRIC RATING
326th/ 347
METRIC RANK
14.7%
MASTER'S DEGREE
36.5/ 100
METRIC RATING
187th/ 347
METRIC RANK
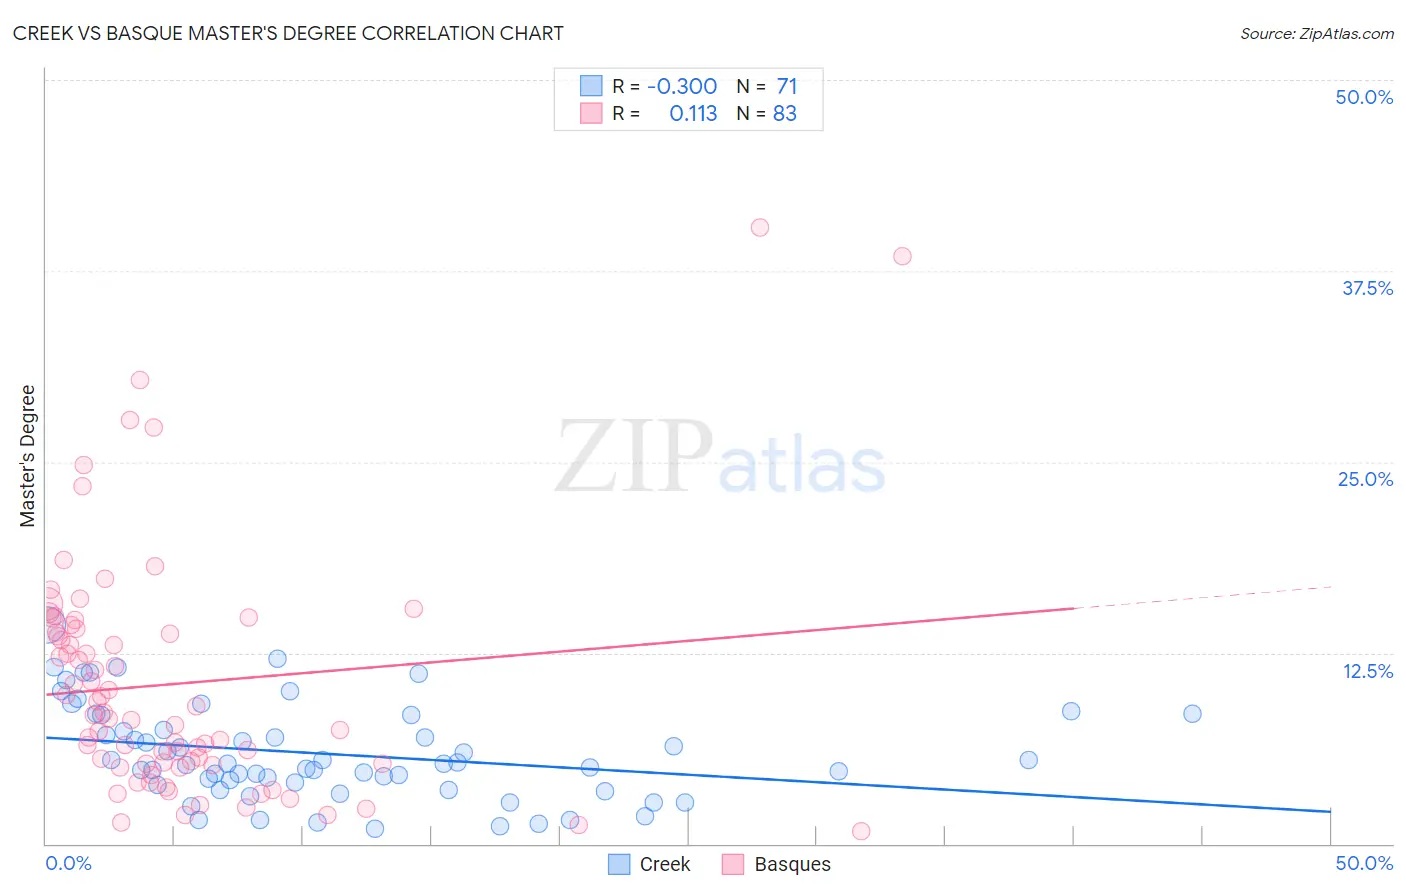
Creek vs Basque Master's Degree Correlation Chart
The statistical analysis conducted on geographies consisting of 178,384,928 people shows a weak negative correlation between the proportion of Creek and percentage of population with at least master's degree education in the United States with a correlation coefficient (R) of -0.300 and weighted average of 10.5%. Similarly, the statistical analysis conducted on geographies consisting of 165,765,652 people shows a poor positive correlation between the proportion of Basques and percentage of population with at least master's degree education in the United States with a correlation coefficient (R) of 0.113 and weighted average of 14.7%, a difference of 39.4%.
Master's Degree Correlation Summary
| Measurement | Creek | Basque |
| Minimum | 0.96% | 0.80% |
| Maximum | 14.3% | 40.4% |
| Range | 13.3% | 39.6% |
| Mean | 5.9% | 10.5% |
| Median | 5.2% | 8.4% |
| Interquartile 25% (IQ1) | 3.9% | 5.2% |
| Interquartile 75% (IQ3) | 8.4% | 14.1% |
| Interquartile Range (IQR) | 4.5% | 8.9% |
| Standard Deviation (Sample) | 3.1% | 7.8% |
| Standard Deviation (Population) | 3.1% | 7.8% |
Similar Demographics by Master's Degree
Demographics Similar to Creek by Master's Degree
In terms of master's degree, the demographic groups most similar to Creek are Inupiat (10.5%, a difference of 0.0%), Paiute (10.5%, a difference of 0.18%), Bangladeshi (10.5%, a difference of 0.32%), Nepalese (10.5%, a difference of 0.40%), and Dutch West Indian (10.6%, a difference of 1.1%).
| Demographics | Rating | Rank | Master's Degree |
| Kiowa | 0.0 /100 | #319 | Tragic 10.8% |
| Immigrants | Micronesia | 0.0 /100 | #320 | Tragic 10.8% |
| Pennsylvania Germans | 0.0 /100 | #321 | Tragic 10.7% |
| Sioux | 0.0 /100 | #322 | Tragic 10.7% |
| Crow | 0.0 /100 | #323 | Tragic 10.6% |
| Dutch West Indians | 0.0 /100 | #324 | Tragic 10.6% |
| Inupiat | 0.0 /100 | #325 | Tragic 10.5% |
| Creek | 0.0 /100 | #326 | Tragic 10.5% |
| Paiute | 0.0 /100 | #327 | Tragic 10.5% |
| Bangladeshis | 0.0 /100 | #328 | Tragic 10.5% |
| Nepalese | 0.0 /100 | #329 | Tragic 10.5% |
| Fijians | 0.0 /100 | #330 | Tragic 10.3% |
| Pueblo | 0.0 /100 | #331 | Tragic 10.3% |
| Immigrants | Azores | 0.0 /100 | #332 | Tragic 10.2% |
| Menominee | 0.0 /100 | #333 | Tragic 10.2% |
Demographics Similar to Basques by Master's Degree
In terms of master's degree, the demographic groups most similar to Basques are Immigrants from Costa Rica (14.7%, a difference of 0.040%), Immigrants from Oceania (14.7%, a difference of 0.080%), Immigrants (14.6%, a difference of 0.080%), Spaniard (14.6%, a difference of 0.10%), and Barbadian (14.7%, a difference of 0.24%).
| Demographics | Rating | Rank | Master's Degree |
| Celtics | 41.3 /100 | #180 | Average 14.8% |
| Swiss | 41.1 /100 | #181 | Average 14.7% |
| Czechs | 40.4 /100 | #182 | Average 14.7% |
| Sri Lankans | 39.6 /100 | #183 | Fair 14.7% |
| Immigrants | Zaire | 39.5 /100 | #184 | Fair 14.7% |
| Barbadians | 38.3 /100 | #185 | Fair 14.7% |
| Immigrants | Oceania | 37.1 /100 | #186 | Fair 14.7% |
| Basques | 36.5 /100 | #187 | Fair 14.7% |
| Immigrants | Costa Rica | 36.2 /100 | #188 | Fair 14.7% |
| Immigrants | Immigrants | 36.0 /100 | #189 | Fair 14.6% |
| Spaniards | 35.8 /100 | #190 | Fair 14.6% |
| Welsh | 34.2 /100 | #191 | Fair 14.6% |
| Immigrants | Middle Africa | 33.6 /100 | #192 | Fair 14.6% |
| Immigrants | Nigeria | 32.7 /100 | #193 | Fair 14.6% |
| Chinese | 32.5 /100 | #194 | Fair 14.6% |