Immigrants from West Indies vs Assyrian/Chaldean/Syriac In Labor Force | Age 25-29
COMPARE
Immigrants from West Indies
Assyrian/Chaldean/Syriac
In Labor Force | Age 25-29
In Labor Force | Age 25-29 Comparison
Immigrants from West Indies
Assyrians/Chaldeans/Syriacs
84.2%
IN LABOR FORCE | AGE 25-29
6.0/ 100
METRIC RATING
224th/ 347
METRIC RANK
84.7%
IN LABOR FORCE | AGE 25-29
50.2/ 100
METRIC RATING
173rd/ 347
METRIC RANK
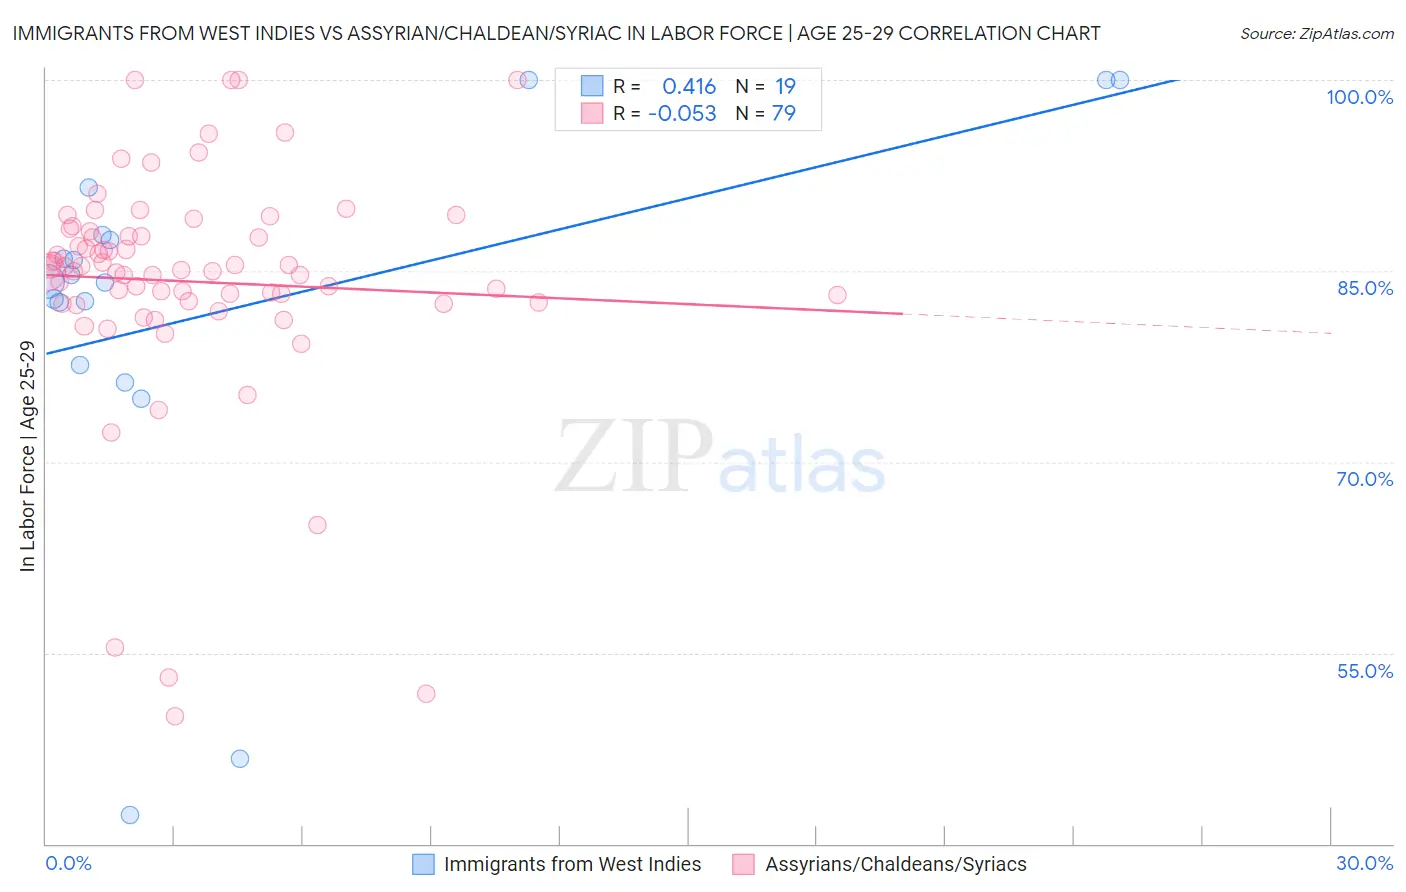
Immigrants from West Indies vs Assyrian/Chaldean/Syriac In Labor Force | Age 25-29 Correlation Chart
The statistical analysis conducted on geographies consisting of 72,456,461 people shows a moderate positive correlation between the proportion of Immigrants from West Indies and labor force participation rate among population between the ages 25 and 29 in the United States with a correlation coefficient (R) of 0.416 and weighted average of 84.2%. Similarly, the statistical analysis conducted on geographies consisting of 110,302,663 people shows a slight negative correlation between the proportion of Assyrians/Chaldeans/Syriacs and labor force participation rate among population between the ages 25 and 29 in the United States with a correlation coefficient (R) of -0.053 and weighted average of 84.7%, a difference of 0.51%.
In Labor Force | Age 25-29 Correlation Summary
| Measurement | Immigrants from West Indies | Assyrian/Chaldean/Syriac |
| Minimum | 42.2% | 50.0% |
| Maximum | 100.0% | 100.0% |
| Range | 57.8% | 50.0% |
| Mean | 82.0% | 84.2% |
| Median | 84.2% | 85.1% |
| Interquartile 25% (IQ1) | 77.6% | 82.5% |
| Interquartile 75% (IQ3) | 87.8% | 88.1% |
| Interquartile Range (IQR) | 10.2% | 5.6% |
| Standard Deviation (Sample) | 15.1% | 9.3% |
| Standard Deviation (Population) | 14.7% | 9.3% |
Similar Demographics by In Labor Force | Age 25-29
Demographics Similar to Immigrants from West Indies by In Labor Force | Age 25-29
In terms of in labor force | age 25-29, the demographic groups most similar to Immigrants from West Indies are Scotch-Irish (84.2%, a difference of 0.010%), Korean (84.2%, a difference of 0.010%), Immigrants from Congo (84.2%, a difference of 0.010%), Arab (84.2%, a difference of 0.020%), and Jordanian (84.2%, a difference of 0.020%).
| Demographics | Rating | Rank | In Labor Force | Age 25-29 |
| Immigrants | Ecuador | 9.3 /100 | #217 | Tragic 84.3% |
| Immigrants | Nigeria | 9.0 /100 | #218 | Tragic 84.3% |
| Immigrants | Saudi Arabia | 8.8 /100 | #219 | Tragic 84.3% |
| Nigerians | 7.2 /100 | #220 | Tragic 84.3% |
| Arabs | 6.8 /100 | #221 | Tragic 84.2% |
| Jordanians | 6.7 /100 | #222 | Tragic 84.2% |
| Scotch-Irish | 6.5 /100 | #223 | Tragic 84.2% |
| Immigrants | West Indies | 6.0 /100 | #224 | Tragic 84.2% |
| Koreans | 5.9 /100 | #225 | Tragic 84.2% |
| Immigrants | Congo | 5.8 /100 | #226 | Tragic 84.2% |
| French American Indians | 5.5 /100 | #227 | Tragic 84.2% |
| Immigrants | Panama | 5.5 /100 | #228 | Tragic 84.2% |
| Immigrants | Oceania | 5.0 /100 | #229 | Tragic 84.2% |
| Whites/Caucasians | 4.8 /100 | #230 | Tragic 84.2% |
| Immigrants | Philippines | 4.7 /100 | #231 | Tragic 84.2% |
Demographics Similar to Assyrians/Chaldeans/Syriacs by In Labor Force | Age 25-29
In terms of in labor force | age 25-29, the demographic groups most similar to Assyrians/Chaldeans/Syriacs are Immigrants from Vietnam (84.7%, a difference of 0.0%), Immigrants from Western Europe (84.7%, a difference of 0.0%), Palestinian (84.7%, a difference of 0.0%), Celtic (84.7%, a difference of 0.020%), and Tongan (84.7%, a difference of 0.020%).
| Demographics | Rating | Rank | In Labor Force | Age 25-29 |
| Immigrants | Spain | 56.9 /100 | #166 | Average 84.7% |
| Indonesians | 56.5 /100 | #167 | Average 84.7% |
| South Americans | 54.9 /100 | #168 | Average 84.7% |
| Celtics | 52.5 /100 | #169 | Average 84.7% |
| Tongans | 52.4 /100 | #170 | Average 84.7% |
| Immigrants | Vietnam | 50.5 /100 | #171 | Average 84.7% |
| Immigrants | Western Europe | 50.4 /100 | #172 | Average 84.7% |
| Assyrians/Chaldeans/Syriacs | 50.2 /100 | #173 | Average 84.7% |
| Palestinians | 50.0 /100 | #174 | Average 84.7% |
| Hungarians | 47.8 /100 | #175 | Average 84.6% |
| Malaysians | 46.8 /100 | #176 | Average 84.6% |
| Immigrants | China | 45.7 /100 | #177 | Average 84.6% |
| Immigrants | Thailand | 45.2 /100 | #178 | Average 84.6% |
| Immigrants | Argentina | 44.0 /100 | #179 | Average 84.6% |
| Immigrants | South America | 42.9 /100 | #180 | Average 84.6% |