Russian vs Assyrian/Chaldean/Syriac In Labor Force | Age 25-29
COMPARE
Russian
Assyrian/Chaldean/Syriac
In Labor Force | Age 25-29
In Labor Force | Age 25-29 Comparison
Russians
Assyrians/Chaldeans/Syriacs
85.3%
IN LABOR FORCE | AGE 25-29
98.8/ 100
METRIC RATING
73rd/ 347
METRIC RANK
84.7%
IN LABOR FORCE | AGE 25-29
50.2/ 100
METRIC RATING
173rd/ 347
METRIC RANK
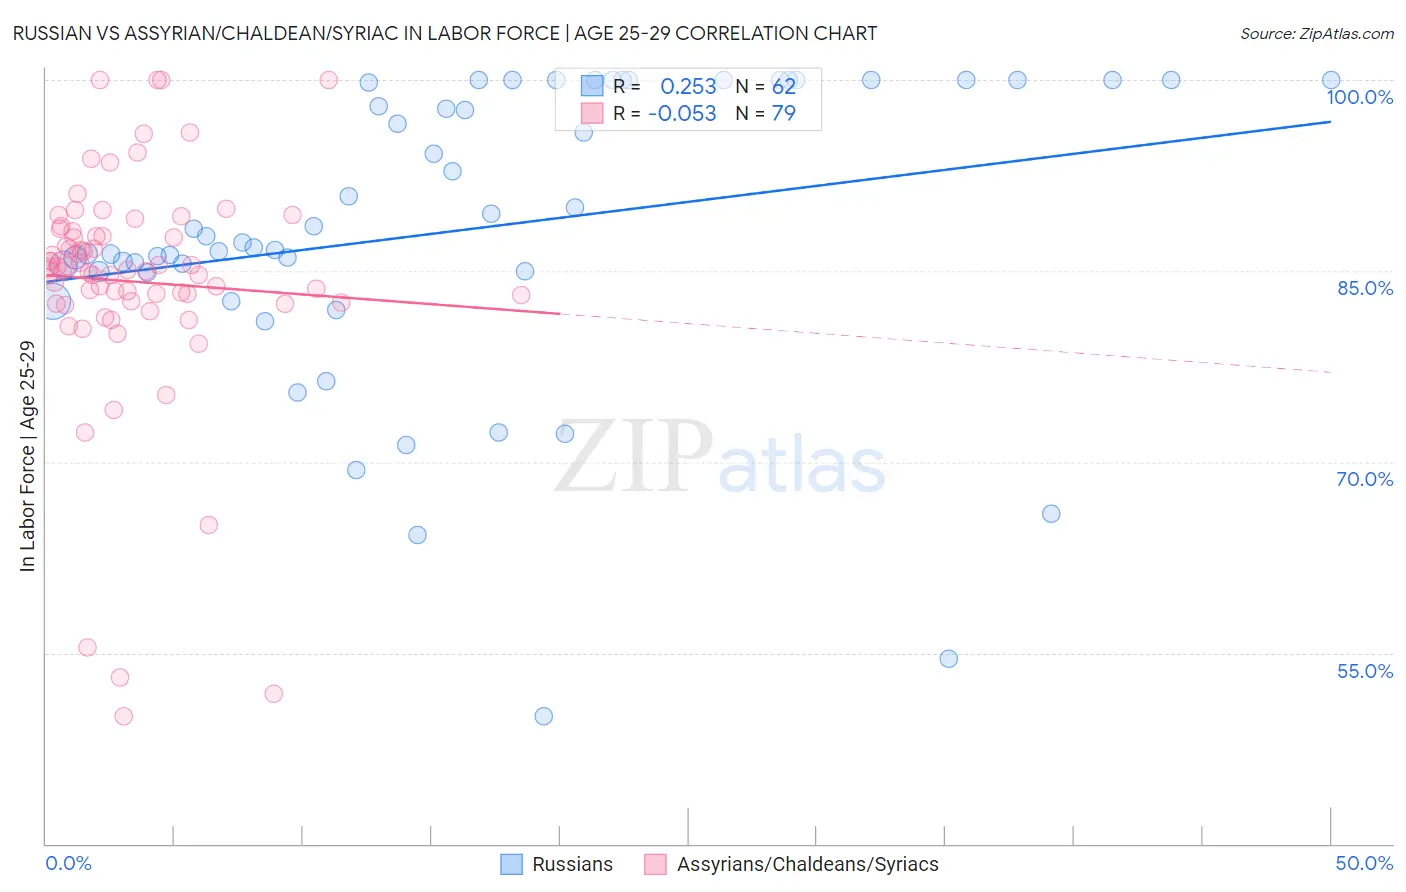
Russian vs Assyrian/Chaldean/Syriac In Labor Force | Age 25-29 Correlation Chart
The statistical analysis conducted on geographies consisting of 511,687,113 people shows a weak positive correlation between the proportion of Russians and labor force participation rate among population between the ages 25 and 29 in the United States with a correlation coefficient (R) of 0.253 and weighted average of 85.3%. Similarly, the statistical analysis conducted on geographies consisting of 110,302,663 people shows a slight negative correlation between the proportion of Assyrians/Chaldeans/Syriacs and labor force participation rate among population between the ages 25 and 29 in the United States with a correlation coefficient (R) of -0.053 and weighted average of 84.7%, a difference of 0.82%.
In Labor Force | Age 25-29 Correlation Summary
| Measurement | Russian | Assyrian/Chaldean/Syriac |
| Minimum | 50.0% | 50.0% |
| Maximum | 100.0% | 100.0% |
| Range | 50.0% | 50.0% |
| Mean | 88.2% | 84.2% |
| Median | 87.5% | 85.1% |
| Interquartile 25% (IQ1) | 85.0% | 82.5% |
| Interquartile 75% (IQ3) | 100.0% | 88.1% |
| Interquartile Range (IQR) | 15.0% | 5.6% |
| Standard Deviation (Sample) | 11.7% | 9.3% |
| Standard Deviation (Population) | 11.6% | 9.3% |
Similar Demographics by In Labor Force | Age 25-29
Demographics Similar to Russians by In Labor Force | Age 25-29
In terms of in labor force | age 25-29, the demographic groups most similar to Russians are Immigrants from Australia (85.3%, a difference of 0.010%), Kenyan (85.4%, a difference of 0.030%), Immigrants from Sweden (85.4%, a difference of 0.040%), Soviet Union (85.3%, a difference of 0.040%), and Menominee (85.4%, a difference of 0.050%).
| Demographics | Rating | Rank | In Labor Force | Age 25-29 |
| Immigrants | Scotland | 99.3 /100 | #66 | Exceptional 85.4% |
| Immigrants | Turkey | 99.2 /100 | #67 | Exceptional 85.4% |
| Immigrants | Cameroon | 99.2 /100 | #68 | Exceptional 85.4% |
| Menominee | 99.1 /100 | #69 | Exceptional 85.4% |
| Immigrants | Sweden | 99.1 /100 | #70 | Exceptional 85.4% |
| Kenyans | 99.0 /100 | #71 | Exceptional 85.4% |
| Immigrants | Australia | 98.9 /100 | #72 | Exceptional 85.3% |
| Russians | 98.8 /100 | #73 | Exceptional 85.3% |
| Soviet Union | 98.5 /100 | #74 | Exceptional 85.3% |
| Brazilians | 98.3 /100 | #75 | Exceptional 85.3% |
| Germans | 98.1 /100 | #76 | Exceptional 85.3% |
| Immigrants | South Central Asia | 97.9 /100 | #77 | Exceptional 85.2% |
| Immigrants | Egypt | 97.7 /100 | #78 | Exceptional 85.2% |
| Immigrants | Northern Africa | 97.6 /100 | #79 | Exceptional 85.2% |
| Immigrants | Zimbabwe | 97.6 /100 | #80 | Exceptional 85.2% |
Demographics Similar to Assyrians/Chaldeans/Syriacs by In Labor Force | Age 25-29
In terms of in labor force | age 25-29, the demographic groups most similar to Assyrians/Chaldeans/Syriacs are Immigrants from Vietnam (84.7%, a difference of 0.0%), Immigrants from Western Europe (84.7%, a difference of 0.0%), Palestinian (84.7%, a difference of 0.0%), Celtic (84.7%, a difference of 0.020%), and Tongan (84.7%, a difference of 0.020%).
| Demographics | Rating | Rank | In Labor Force | Age 25-29 |
| Immigrants | Spain | 56.9 /100 | #166 | Average 84.7% |
| Indonesians | 56.5 /100 | #167 | Average 84.7% |
| South Americans | 54.9 /100 | #168 | Average 84.7% |
| Celtics | 52.5 /100 | #169 | Average 84.7% |
| Tongans | 52.4 /100 | #170 | Average 84.7% |
| Immigrants | Vietnam | 50.5 /100 | #171 | Average 84.7% |
| Immigrants | Western Europe | 50.4 /100 | #172 | Average 84.7% |
| Assyrians/Chaldeans/Syriacs | 50.2 /100 | #173 | Average 84.7% |
| Palestinians | 50.0 /100 | #174 | Average 84.7% |
| Hungarians | 47.8 /100 | #175 | Average 84.6% |
| Malaysians | 46.8 /100 | #176 | Average 84.6% |
| Immigrants | China | 45.7 /100 | #177 | Average 84.6% |
| Immigrants | Thailand | 45.2 /100 | #178 | Average 84.6% |
| Immigrants | Argentina | 44.0 /100 | #179 | Average 84.6% |
| Immigrants | South America | 42.9 /100 | #180 | Average 84.6% |