Costa Rican vs Immigrants from Korea In Labor Force | Age 25-29
COMPARE
Costa Rican
Immigrants from Korea
In Labor Force | Age 25-29
In Labor Force | Age 25-29 Comparison
Costa Ricans
Immigrants from Korea
85.0%
IN LABOR FORCE | AGE 25-29
91.9/ 100
METRIC RATING
109th/ 347
METRIC RANK
85.1%
IN LABOR FORCE | AGE 25-29
94.8/ 100
METRIC RATING
94th/ 347
METRIC RANK
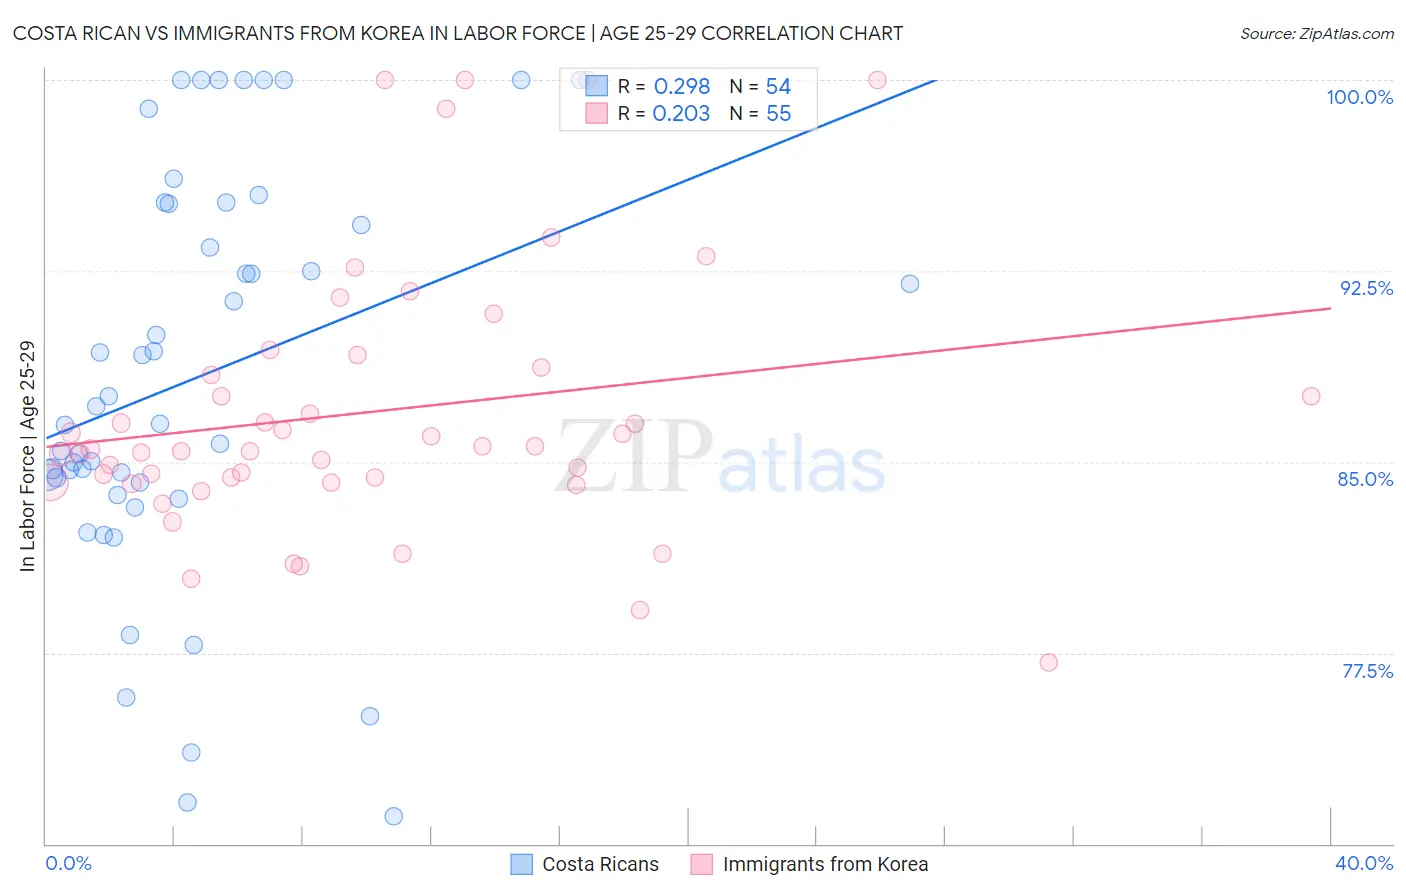
Costa Rican vs Immigrants from Korea In Labor Force | Age 25-29 Correlation Chart
The statistical analysis conducted on geographies consisting of 253,578,861 people shows a weak positive correlation between the proportion of Costa Ricans and labor force participation rate among population between the ages 25 and 29 in the United States with a correlation coefficient (R) of 0.298 and weighted average of 85.0%. Similarly, the statistical analysis conducted on geographies consisting of 416,167,455 people shows a weak positive correlation between the proportion of Immigrants from Korea and labor force participation rate among population between the ages 25 and 29 in the United States with a correlation coefficient (R) of 0.203 and weighted average of 85.1%, a difference of 0.090%.
In Labor Force | Age 25-29 Correlation Summary
| Measurement | Costa Rican | Immigrants from Korea |
| Minimum | 71.1% | 77.1% |
| Maximum | 100.0% | 100.0% |
| Range | 28.9% | 22.9% |
| Mean | 88.3% | 87.0% |
| Median | 86.9% | 85.5% |
| Interquartile 25% (IQ1) | 84.2% | 84.2% |
| Interquartile 75% (IQ3) | 95.2% | 88.7% |
| Interquartile Range (IQR) | 11.0% | 4.5% |
| Standard Deviation (Sample) | 7.9% | 5.2% |
| Standard Deviation (Population) | 7.8% | 5.2% |
Demographics Similar to Costa Ricans and Immigrants from Korea by In Labor Force | Age 25-29
In terms of in labor force | age 25-29, the demographic groups most similar to Costa Ricans are Immigrants from Austria (85.0%, a difference of 0.0%), Immigrants from Southern Europe (85.0%, a difference of 0.010%), New Zealander (85.0%, a difference of 0.010%), Immigrants from Middle Africa (85.0%, a difference of 0.010%), and Immigrants from Hong Kong (85.0%, a difference of 0.020%). Similarly, the demographic groups most similar to Immigrants from Korea are Immigrants from Netherlands (85.1%, a difference of 0.010%), Immigrants from Romania (85.1%, a difference of 0.010%), Austrian (85.1%, a difference of 0.020%), Immigrants from Sudan (85.1%, a difference of 0.020%), and Immigrants from Costa Rica (85.1%, a difference of 0.030%).
| Demographics | Rating | Rank | In Labor Force | Age 25-29 |
| Immigrants | Moldova | 95.8 /100 | #91 | Exceptional 85.1% |
| Immigrants | Costa Rica | 95.5 /100 | #92 | Exceptional 85.1% |
| Austrians | 95.3 /100 | #93 | Exceptional 85.1% |
| Immigrants | Korea | 94.8 /100 | #94 | Exceptional 85.1% |
| Immigrants | Netherlands | 94.6 /100 | #95 | Exceptional 85.1% |
| Immigrants | Romania | 94.6 /100 | #96 | Exceptional 85.1% |
| Immigrants | Sudan | 94.3 /100 | #97 | Exceptional 85.1% |
| Mongolians | 94.1 /100 | #98 | Exceptional 85.1% |
| Bangladeshis | 94.0 /100 | #99 | Exceptional 85.1% |
| Immigrants | Switzerland | 93.9 /100 | #100 | Exceptional 85.1% |
| Egyptians | 93.8 /100 | #101 | Exceptional 85.1% |
| Slavs | 93.7 /100 | #102 | Exceptional 85.1% |
| Immigrants | Japan | 93.5 /100 | #103 | Exceptional 85.1% |
| Immigrants | Zaire | 93.3 /100 | #104 | Exceptional 85.1% |
| Immigrants | Hong Kong | 92.8 /100 | #105 | Exceptional 85.0% |
| Czechoslovakians | 92.6 /100 | #106 | Exceptional 85.0% |
| Immigrants | Southern Europe | 92.3 /100 | #107 | Exceptional 85.0% |
| Immigrants | Austria | 91.9 /100 | #108 | Exceptional 85.0% |
| Costa Ricans | 91.9 /100 | #109 | Exceptional 85.0% |
| New Zealanders | 91.5 /100 | #110 | Exceptional 85.0% |
| Immigrants | Middle Africa | 91.4 /100 | #111 | Exceptional 85.0% |