Honduran vs Immigrants from Korea In Labor Force | Age 25-29
COMPARE
Honduran
Immigrants from Korea
In Labor Force | Age 25-29
In Labor Force | Age 25-29 Comparison
Hondurans
Immigrants from Korea
83.4%
IN LABOR FORCE | AGE 25-29
0.0/ 100
METRIC RATING
271st/ 347
METRIC RANK
85.1%
IN LABOR FORCE | AGE 25-29
94.8/ 100
METRIC RATING
94th/ 347
METRIC RANK
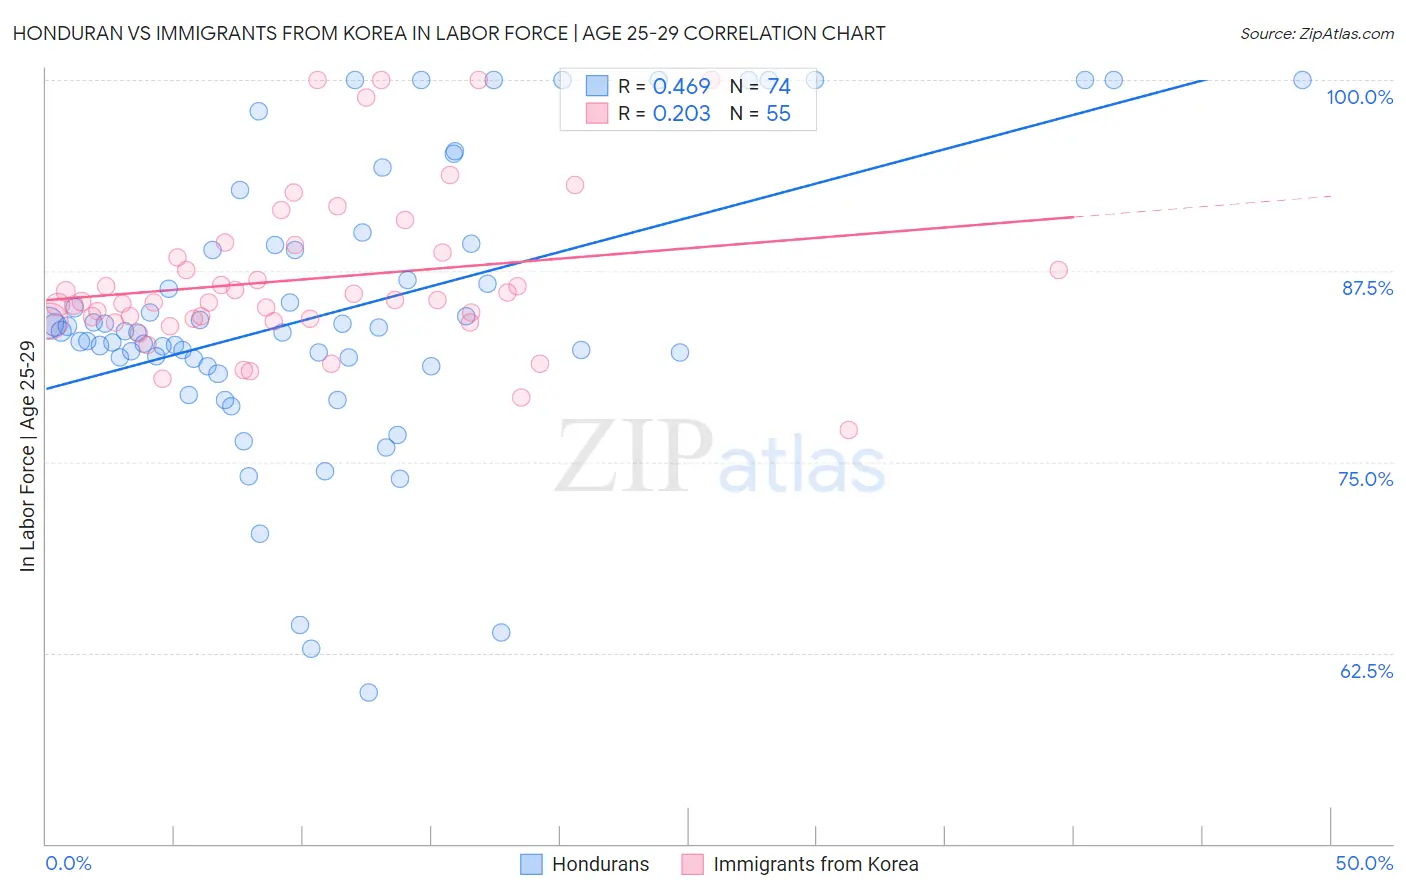
Honduran vs Immigrants from Korea In Labor Force | Age 25-29 Correlation Chart
The statistical analysis conducted on geographies consisting of 357,747,922 people shows a moderate positive correlation between the proportion of Hondurans and labor force participation rate among population between the ages 25 and 29 in the United States with a correlation coefficient (R) of 0.469 and weighted average of 83.4%. Similarly, the statistical analysis conducted on geographies consisting of 416,167,455 people shows a weak positive correlation between the proportion of Immigrants from Korea and labor force participation rate among population between the ages 25 and 29 in the United States with a correlation coefficient (R) of 0.203 and weighted average of 85.1%, a difference of 2.1%.
In Labor Force | Age 25-29 Correlation Summary
| Measurement | Honduran | Immigrants from Korea |
| Minimum | 59.9% | 77.1% |
| Maximum | 100.0% | 100.0% |
| Range | 40.1% | 22.9% |
| Mean | 84.8% | 87.0% |
| Median | 83.5% | 85.5% |
| Interquartile 25% (IQ1) | 81.7% | 84.2% |
| Interquartile 75% (IQ3) | 89.2% | 88.7% |
| Interquartile Range (IQR) | 7.5% | 4.5% |
| Standard Deviation (Sample) | 9.2% | 5.2% |
| Standard Deviation (Population) | 9.2% | 5.2% |
Similar Demographics by In Labor Force | Age 25-29
Demographics Similar to Hondurans by In Labor Force | Age 25-29
In terms of in labor force | age 25-29, the demographic groups most similar to Hondurans are Basque (83.4%, a difference of 0.020%), Immigrants from Caribbean (83.4%, a difference of 0.030%), Immigrants from Lebanon (83.4%, a difference of 0.040%), Immigrants from Barbados (83.4%, a difference of 0.040%), and Immigrants from Dominica (83.4%, a difference of 0.040%).
| Demographics | Rating | Rank | In Labor Force | Age 25-29 |
| Puget Sound Salish | 0.1 /100 | #264 | Tragic 83.5% |
| Cubans | 0.1 /100 | #265 | Tragic 83.5% |
| Aleuts | 0.0 /100 | #266 | Tragic 83.4% |
| Spanish Americans | 0.0 /100 | #267 | Tragic 83.4% |
| Immigrants | Lebanon | 0.0 /100 | #268 | Tragic 83.4% |
| Immigrants | Barbados | 0.0 /100 | #269 | Tragic 83.4% |
| Basques | 0.0 /100 | #270 | Tragic 83.4% |
| Hondurans | 0.0 /100 | #271 | Tragic 83.4% |
| Immigrants | Caribbean | 0.0 /100 | #272 | Tragic 83.4% |
| Immigrants | Dominica | 0.0 /100 | #273 | Tragic 83.4% |
| Marshallese | 0.0 /100 | #274 | Tragic 83.3% |
| Samoans | 0.0 /100 | #275 | Tragic 83.3% |
| Immigrants | Honduras | 0.0 /100 | #276 | Tragic 83.3% |
| Africans | 0.0 /100 | #277 | Tragic 83.2% |
| Immigrants | Cuba | 0.0 /100 | #278 | Tragic 83.2% |
Demographics Similar to Immigrants from Korea by In Labor Force | Age 25-29
In terms of in labor force | age 25-29, the demographic groups most similar to Immigrants from Korea are Immigrants from Netherlands (85.1%, a difference of 0.010%), Immigrants from Romania (85.1%, a difference of 0.010%), Austrian (85.1%, a difference of 0.020%), Immigrants from Sudan (85.1%, a difference of 0.020%), and Immigrants from Costa Rica (85.1%, a difference of 0.030%).
| Demographics | Rating | Rank | In Labor Force | Age 25-29 |
| French Canadians | 96.5 /100 | #87 | Exceptional 85.2% |
| Immigrants | Croatia | 96.4 /100 | #88 | Exceptional 85.2% |
| Immigrants | France | 96.3 /100 | #89 | Exceptional 85.2% |
| Burmese | 95.9 /100 | #90 | Exceptional 85.1% |
| Immigrants | Moldova | 95.8 /100 | #91 | Exceptional 85.1% |
| Immigrants | Costa Rica | 95.5 /100 | #92 | Exceptional 85.1% |
| Austrians | 95.3 /100 | #93 | Exceptional 85.1% |
| Immigrants | Korea | 94.8 /100 | #94 | Exceptional 85.1% |
| Immigrants | Netherlands | 94.6 /100 | #95 | Exceptional 85.1% |
| Immigrants | Romania | 94.6 /100 | #96 | Exceptional 85.1% |
| Immigrants | Sudan | 94.3 /100 | #97 | Exceptional 85.1% |
| Mongolians | 94.1 /100 | #98 | Exceptional 85.1% |
| Bangladeshis | 94.0 /100 | #99 | Exceptional 85.1% |
| Immigrants | Switzerland | 93.9 /100 | #100 | Exceptional 85.1% |
| Egyptians | 93.8 /100 | #101 | Exceptional 85.1% |