Costa Rican vs Blackfeet In Labor Force | Age 25-29
COMPARE
Costa Rican
Blackfeet
In Labor Force | Age 25-29
In Labor Force | Age 25-29 Comparison
Costa Ricans
Blackfeet
85.0%
IN LABOR FORCE | AGE 25-29
91.9/ 100
METRIC RATING
109th/ 347
METRIC RANK
82.6%
IN LABOR FORCE | AGE 25-29
0.0/ 100
METRIC RATING
306th/ 347
METRIC RANK
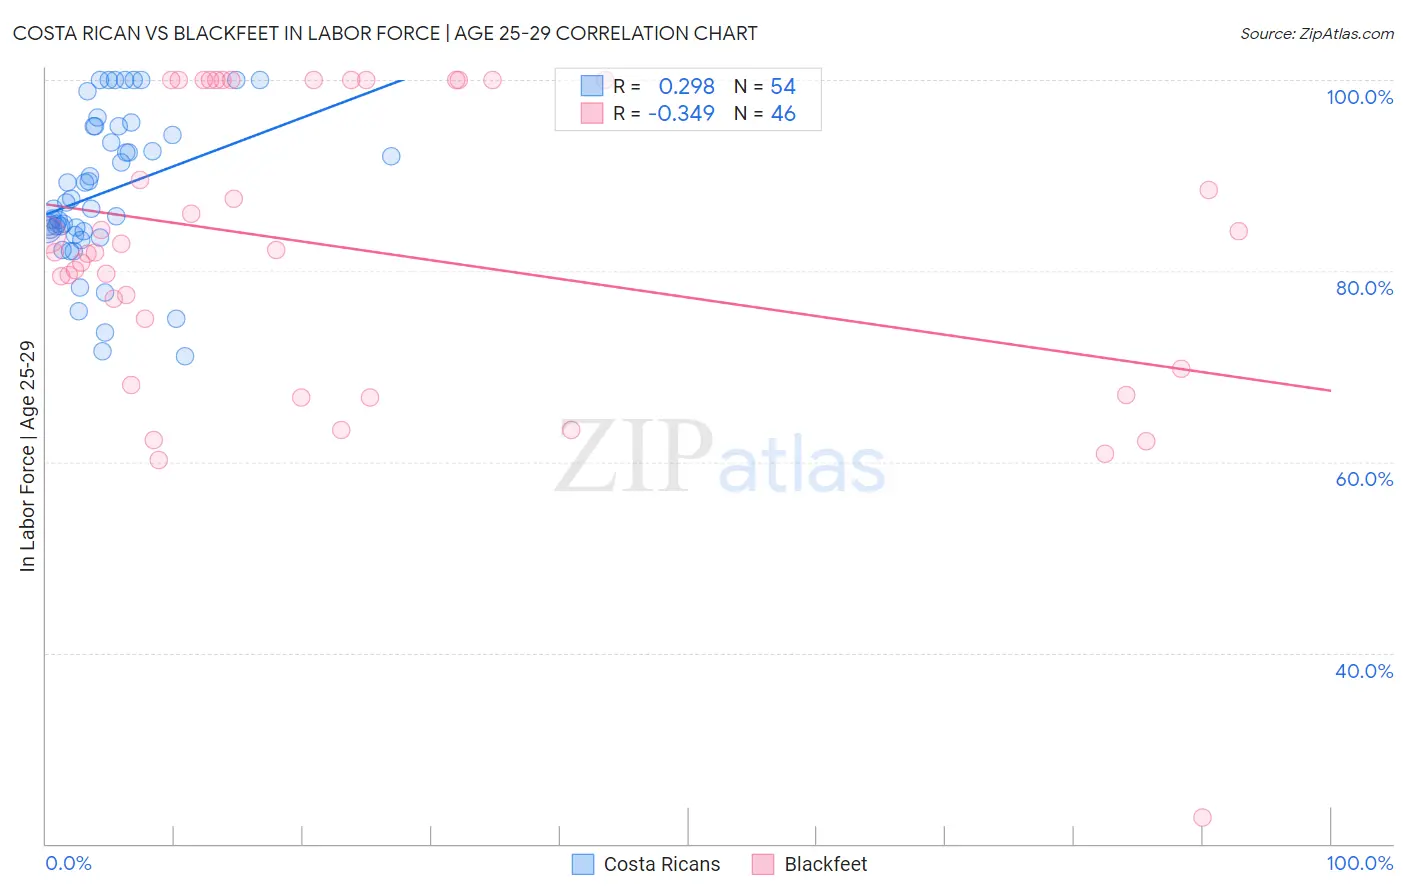
Costa Rican vs Blackfeet In Labor Force | Age 25-29 Correlation Chart
The statistical analysis conducted on geographies consisting of 253,578,861 people shows a weak positive correlation between the proportion of Costa Ricans and labor force participation rate among population between the ages 25 and 29 in the United States with a correlation coefficient (R) of 0.298 and weighted average of 85.0%. Similarly, the statistical analysis conducted on geographies consisting of 309,474,956 people shows a mild negative correlation between the proportion of Blackfeet and labor force participation rate among population between the ages 25 and 29 in the United States with a correlation coefficient (R) of -0.349 and weighted average of 82.6%, a difference of 2.9%.
In Labor Force | Age 25-29 Correlation Summary
| Measurement | Costa Rican | Blackfeet |
| Minimum | 71.1% | 22.7% |
| Maximum | 100.0% | 100.0% |
| Range | 28.9% | 77.3% |
| Mean | 88.3% | 82.1% |
| Median | 86.9% | 82.1% |
| Interquartile 25% (IQ1) | 84.2% | 69.8% |
| Interquartile 75% (IQ3) | 95.2% | 100.0% |
| Interquartile Range (IQR) | 11.0% | 30.2% |
| Standard Deviation (Sample) | 7.9% | 16.2% |
| Standard Deviation (Population) | 7.8% | 16.0% |
Similar Demographics by In Labor Force | Age 25-29
Demographics Similar to Costa Ricans by In Labor Force | Age 25-29
In terms of in labor force | age 25-29, the demographic groups most similar to Costa Ricans are Immigrants from Austria (85.0%, a difference of 0.0%), Immigrants from Southern Europe (85.0%, a difference of 0.010%), New Zealander (85.0%, a difference of 0.010%), Immigrants from Middle Africa (85.0%, a difference of 0.010%), and Immigrants from Hong Kong (85.0%, a difference of 0.020%).
| Demographics | Rating | Rank | In Labor Force | Age 25-29 |
| Slavs | 93.7 /100 | #102 | Exceptional 85.1% |
| Immigrants | Japan | 93.5 /100 | #103 | Exceptional 85.1% |
| Immigrants | Zaire | 93.3 /100 | #104 | Exceptional 85.1% |
| Immigrants | Hong Kong | 92.8 /100 | #105 | Exceptional 85.0% |
| Czechoslovakians | 92.6 /100 | #106 | Exceptional 85.0% |
| Immigrants | Southern Europe | 92.3 /100 | #107 | Exceptional 85.0% |
| Immigrants | Austria | 91.9 /100 | #108 | Exceptional 85.0% |
| Costa Ricans | 91.9 /100 | #109 | Exceptional 85.0% |
| New Zealanders | 91.5 /100 | #110 | Exceptional 85.0% |
| Immigrants | Middle Africa | 91.4 /100 | #111 | Exceptional 85.0% |
| Senegalese | 90.9 /100 | #112 | Exceptional 85.0% |
| Irish | 90.6 /100 | #113 | Exceptional 85.0% |
| Immigrants | Malaysia | 90.4 /100 | #114 | Exceptional 85.0% |
| South Africans | 88.9 /100 | #115 | Excellent 85.0% |
| Chileans | 88.8 /100 | #116 | Excellent 85.0% |
Demographics Similar to Blackfeet by In Labor Force | Age 25-29
In terms of in labor force | age 25-29, the demographic groups most similar to Blackfeet are Black/African American (82.6%, a difference of 0.010%), Cajun (82.5%, a difference of 0.060%), Immigrants from St. Vincent and the Grenadines (82.7%, a difference of 0.13%), Central American Indian (82.4%, a difference of 0.21%), and Immigrants from Central America (82.4%, a difference of 0.22%).
| Demographics | Rating | Rank | In Labor Force | Age 25-29 |
| Fijians | 0.0 /100 | #299 | Tragic 82.9% |
| Spanish American Indians | 0.0 /100 | #300 | Tragic 82.9% |
| Vietnamese | 0.0 /100 | #301 | Tragic 82.8% |
| Immigrants | Belize | 0.0 /100 | #302 | Tragic 82.8% |
| Immigrants | Grenada | 0.0 /100 | #303 | Tragic 82.8% |
| Immigrants | St. Vincent and the Grenadines | 0.0 /100 | #304 | Tragic 82.7% |
| Blacks/African Americans | 0.0 /100 | #305 | Tragic 82.6% |
| Blackfeet | 0.0 /100 | #306 | Tragic 82.6% |
| Cajuns | 0.0 /100 | #307 | Tragic 82.5% |
| Central American Indians | 0.0 /100 | #308 | Tragic 82.4% |
| Immigrants | Central America | 0.0 /100 | #309 | Tragic 82.4% |
| Osage | 0.0 /100 | #310 | Tragic 82.3% |
| Alaskan Athabascans | 0.0 /100 | #311 | Tragic 82.3% |
| Hispanics or Latinos | 0.0 /100 | #312 | Tragic 82.2% |
| Yaqui | 0.0 /100 | #313 | Tragic 82.2% |