Costa Rican vs Menominee In Labor Force | Age 25-29
COMPARE
Costa Rican
Menominee
In Labor Force | Age 25-29
In Labor Force | Age 25-29 Comparison
Costa Ricans
Menominee
85.0%
IN LABOR FORCE | AGE 25-29
91.9/ 100
METRIC RATING
109th/ 347
METRIC RANK
85.4%
IN LABOR FORCE | AGE 25-29
99.1/ 100
METRIC RATING
69th/ 347
METRIC RANK
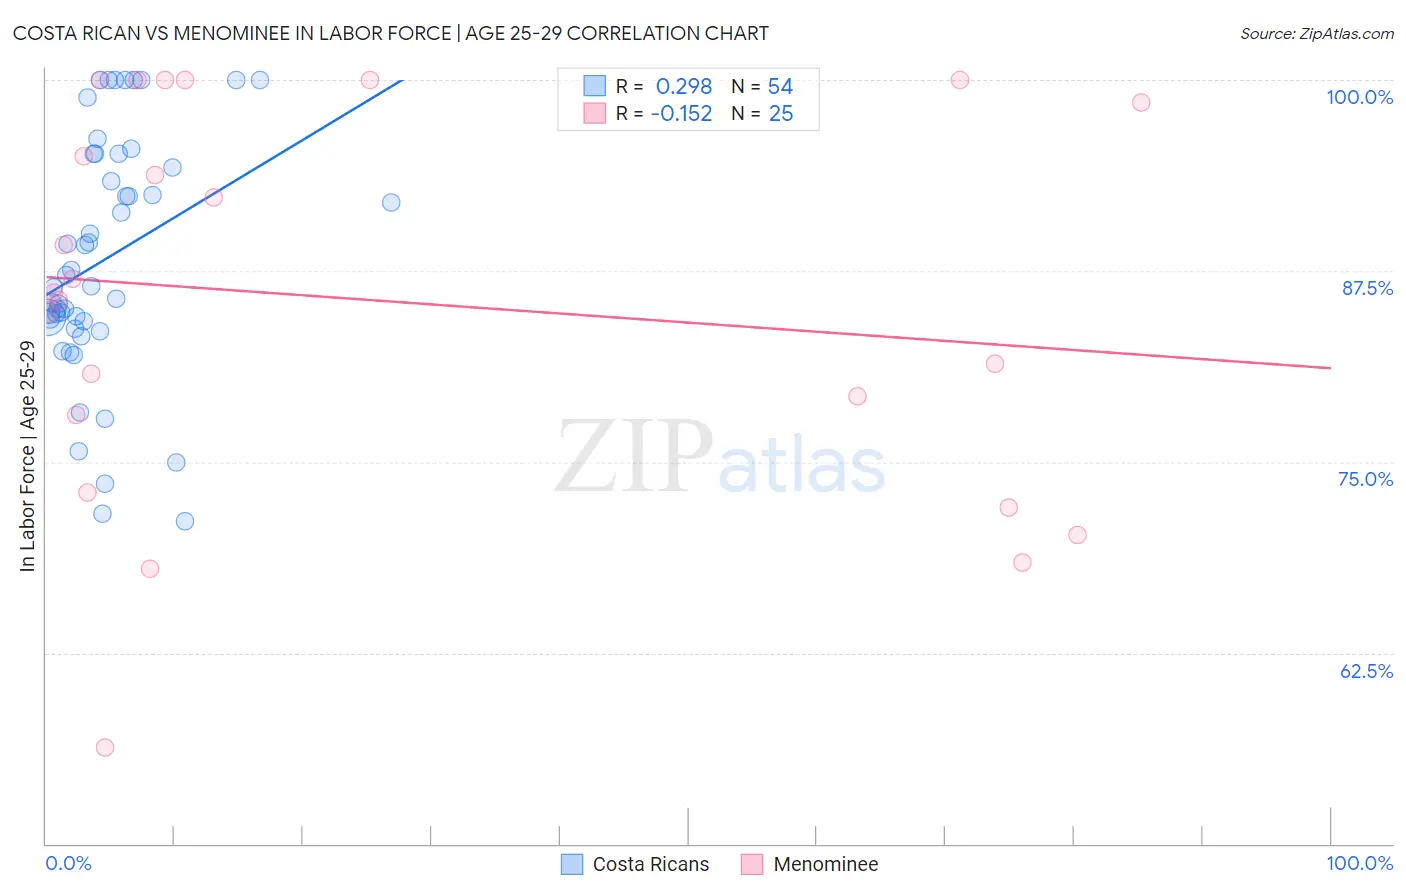
Costa Rican vs Menominee In Labor Force | Age 25-29 Correlation Chart
The statistical analysis conducted on geographies consisting of 253,578,861 people shows a weak positive correlation between the proportion of Costa Ricans and labor force participation rate among population between the ages 25 and 29 in the United States with a correlation coefficient (R) of 0.298 and weighted average of 85.0%. Similarly, the statistical analysis conducted on geographies consisting of 45,777,476 people shows a poor negative correlation between the proportion of Menominee and labor force participation rate among population between the ages 25 and 29 in the United States with a correlation coefficient (R) of -0.152 and weighted average of 85.4%, a difference of 0.41%.
In Labor Force | Age 25-29 Correlation Summary
| Measurement | Costa Rican | Menominee |
| Minimum | 71.1% | 56.3% |
| Maximum | 100.0% | 100.0% |
| Range | 28.9% | 43.7% |
| Mean | 88.3% | 85.6% |
| Median | 86.9% | 86.1% |
| Interquartile 25% (IQ1) | 84.2% | 75.5% |
| Interquartile 75% (IQ3) | 95.2% | 99.3% |
| Interquartile Range (IQR) | 11.0% | 23.7% |
| Standard Deviation (Sample) | 7.9% | 12.6% |
| Standard Deviation (Population) | 7.8% | 12.3% |
Similar Demographics by In Labor Force | Age 25-29
Demographics Similar to Costa Ricans by In Labor Force | Age 25-29
In terms of in labor force | age 25-29, the demographic groups most similar to Costa Ricans are Immigrants from Austria (85.0%, a difference of 0.0%), Immigrants from Southern Europe (85.0%, a difference of 0.010%), New Zealander (85.0%, a difference of 0.010%), Immigrants from Middle Africa (85.0%, a difference of 0.010%), and Immigrants from Hong Kong (85.0%, a difference of 0.020%).
| Demographics | Rating | Rank | In Labor Force | Age 25-29 |
| Slavs | 93.7 /100 | #102 | Exceptional 85.1% |
| Immigrants | Japan | 93.5 /100 | #103 | Exceptional 85.1% |
| Immigrants | Zaire | 93.3 /100 | #104 | Exceptional 85.1% |
| Immigrants | Hong Kong | 92.8 /100 | #105 | Exceptional 85.0% |
| Czechoslovakians | 92.6 /100 | #106 | Exceptional 85.0% |
| Immigrants | Southern Europe | 92.3 /100 | #107 | Exceptional 85.0% |
| Immigrants | Austria | 91.9 /100 | #108 | Exceptional 85.0% |
| Costa Ricans | 91.9 /100 | #109 | Exceptional 85.0% |
| New Zealanders | 91.5 /100 | #110 | Exceptional 85.0% |
| Immigrants | Middle Africa | 91.4 /100 | #111 | Exceptional 85.0% |
| Senegalese | 90.9 /100 | #112 | Exceptional 85.0% |
| Irish | 90.6 /100 | #113 | Exceptional 85.0% |
| Immigrants | Malaysia | 90.4 /100 | #114 | Exceptional 85.0% |
| South Africans | 88.9 /100 | #115 | Excellent 85.0% |
| Chileans | 88.8 /100 | #116 | Excellent 85.0% |
Demographics Similar to Menominee by In Labor Force | Age 25-29
In terms of in labor force | age 25-29, the demographic groups most similar to Menominee are Immigrants from Sweden (85.4%, a difference of 0.0%), Immigrants from Cameroon (85.4%, a difference of 0.020%), Kenyan (85.4%, a difference of 0.020%), Immigrants from Turkey (85.4%, a difference of 0.030%), and Immigrants from Scotland (85.4%, a difference of 0.040%).
| Demographics | Rating | Rank | In Labor Force | Age 25-29 |
| Taiwanese | 99.4 /100 | #62 | Exceptional 85.4% |
| Immigrants | Kenya | 99.4 /100 | #63 | Exceptional 85.4% |
| Immigrants | Italy | 99.3 /100 | #64 | Exceptional 85.4% |
| Immigrants | Czechoslovakia | 99.3 /100 | #65 | Exceptional 85.4% |
| Immigrants | Scotland | 99.3 /100 | #66 | Exceptional 85.4% |
| Immigrants | Turkey | 99.2 /100 | #67 | Exceptional 85.4% |
| Immigrants | Cameroon | 99.2 /100 | #68 | Exceptional 85.4% |
| Menominee | 99.1 /100 | #69 | Exceptional 85.4% |
| Immigrants | Sweden | 99.1 /100 | #70 | Exceptional 85.4% |
| Kenyans | 99.0 /100 | #71 | Exceptional 85.4% |
| Immigrants | Australia | 98.9 /100 | #72 | Exceptional 85.3% |
| Russians | 98.8 /100 | #73 | Exceptional 85.3% |
| Soviet Union | 98.5 /100 | #74 | Exceptional 85.3% |
| Brazilians | 98.3 /100 | #75 | Exceptional 85.3% |
| Germans | 98.1 /100 | #76 | Exceptional 85.3% |