Costa Rican vs Immigrants from Thailand In Labor Force | Age 25-29
COMPARE
Costa Rican
Immigrants from Thailand
In Labor Force | Age 25-29
In Labor Force | Age 25-29 Comparison
Costa Ricans
Immigrants from Thailand
85.0%
IN LABOR FORCE | AGE 25-29
91.9/ 100
METRIC RATING
109th/ 347
METRIC RANK
84.6%
IN LABOR FORCE | AGE 25-29
45.2/ 100
METRIC RATING
178th/ 347
METRIC RANK
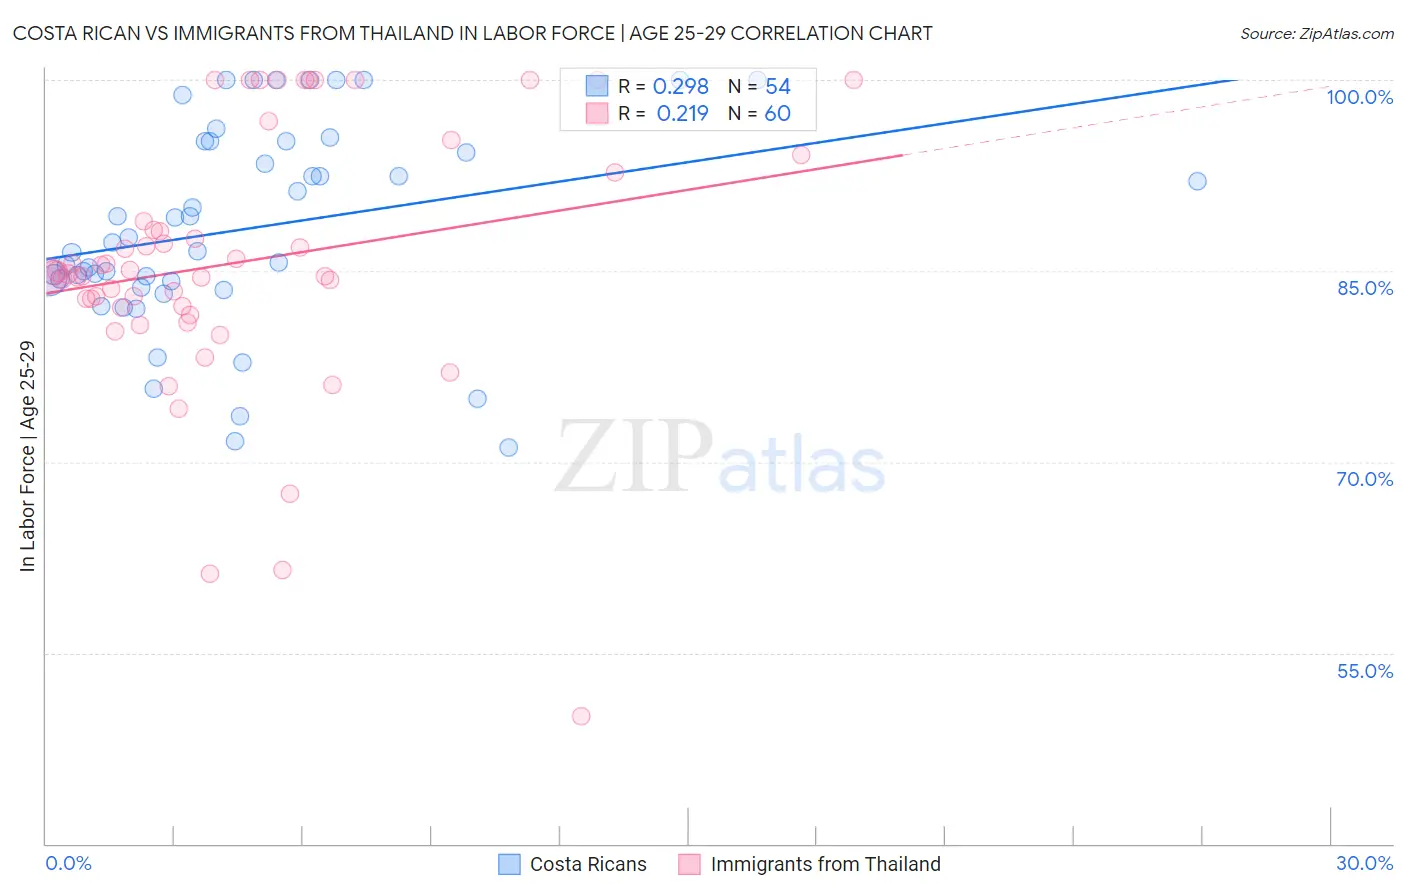
Costa Rican vs Immigrants from Thailand In Labor Force | Age 25-29 Correlation Chart
The statistical analysis conducted on geographies consisting of 253,578,861 people shows a weak positive correlation between the proportion of Costa Ricans and labor force participation rate among population between the ages 25 and 29 in the United States with a correlation coefficient (R) of 0.298 and weighted average of 85.0%. Similarly, the statistical analysis conducted on geographies consisting of 316,978,780 people shows a weak positive correlation between the proportion of Immigrants from Thailand and labor force participation rate among population between the ages 25 and 29 in the United States with a correlation coefficient (R) of 0.219 and weighted average of 84.6%, a difference of 0.48%.
In Labor Force | Age 25-29 Correlation Summary
| Measurement | Costa Rican | Immigrants from Thailand |
| Minimum | 71.1% | 50.0% |
| Maximum | 100.0% | 100.0% |
| Range | 28.9% | 50.0% |
| Mean | 88.3% | 85.7% |
| Median | 86.9% | 84.8% |
| Interquartile 25% (IQ1) | 84.2% | 82.2% |
| Interquartile 75% (IQ3) | 95.2% | 90.8% |
| Interquartile Range (IQR) | 11.0% | 8.6% |
| Standard Deviation (Sample) | 7.9% | 10.1% |
| Standard Deviation (Population) | 7.8% | 10.1% |
Similar Demographics by In Labor Force | Age 25-29
Demographics Similar to Costa Ricans by In Labor Force | Age 25-29
In terms of in labor force | age 25-29, the demographic groups most similar to Costa Ricans are Immigrants from Austria (85.0%, a difference of 0.0%), Immigrants from Southern Europe (85.0%, a difference of 0.010%), New Zealander (85.0%, a difference of 0.010%), Immigrants from Middle Africa (85.0%, a difference of 0.010%), and Immigrants from Hong Kong (85.0%, a difference of 0.020%).
| Demographics | Rating | Rank | In Labor Force | Age 25-29 |
| Slavs | 93.7 /100 | #102 | Exceptional 85.1% |
| Immigrants | Japan | 93.5 /100 | #103 | Exceptional 85.1% |
| Immigrants | Zaire | 93.3 /100 | #104 | Exceptional 85.1% |
| Immigrants | Hong Kong | 92.8 /100 | #105 | Exceptional 85.0% |
| Czechoslovakians | 92.6 /100 | #106 | Exceptional 85.0% |
| Immigrants | Southern Europe | 92.3 /100 | #107 | Exceptional 85.0% |
| Immigrants | Austria | 91.9 /100 | #108 | Exceptional 85.0% |
| Costa Ricans | 91.9 /100 | #109 | Exceptional 85.0% |
| New Zealanders | 91.5 /100 | #110 | Exceptional 85.0% |
| Immigrants | Middle Africa | 91.4 /100 | #111 | Exceptional 85.0% |
| Senegalese | 90.9 /100 | #112 | Exceptional 85.0% |
| Irish | 90.6 /100 | #113 | Exceptional 85.0% |
| Immigrants | Malaysia | 90.4 /100 | #114 | Exceptional 85.0% |
| South Africans | 88.9 /100 | #115 | Excellent 85.0% |
| Chileans | 88.8 /100 | #116 | Excellent 85.0% |
Demographics Similar to Immigrants from Thailand by In Labor Force | Age 25-29
In terms of in labor force | age 25-29, the demographic groups most similar to Immigrants from Thailand are Immigrants from China (84.6%, a difference of 0.0%), Malaysian (84.6%, a difference of 0.010%), Immigrants from Argentina (84.6%, a difference of 0.010%), Hungarian (84.6%, a difference of 0.020%), and Immigrants from South America (84.6%, a difference of 0.020%).
| Demographics | Rating | Rank | In Labor Force | Age 25-29 |
| Immigrants | Vietnam | 50.5 /100 | #171 | Average 84.7% |
| Immigrants | Western Europe | 50.4 /100 | #172 | Average 84.7% |
| Assyrians/Chaldeans/Syriacs | 50.2 /100 | #173 | Average 84.7% |
| Palestinians | 50.0 /100 | #174 | Average 84.7% |
| Hungarians | 47.8 /100 | #175 | Average 84.6% |
| Malaysians | 46.8 /100 | #176 | Average 84.6% |
| Immigrants | China | 45.7 /100 | #177 | Average 84.6% |
| Immigrants | Thailand | 45.2 /100 | #178 | Average 84.6% |
| Immigrants | Argentina | 44.0 /100 | #179 | Average 84.6% |
| Immigrants | South America | 42.9 /100 | #180 | Average 84.6% |
| Immigrants | Norway | 41.9 /100 | #181 | Average 84.6% |
| Europeans | 40.3 /100 | #182 | Average 84.6% |
| Scottish | 40.1 /100 | #183 | Average 84.6% |
| Immigrants | Kuwait | 38.2 /100 | #184 | Fair 84.6% |
| Immigrants | Denmark | 37.0 /100 | #185 | Fair 84.6% |