Comanche vs Serbian In Labor Force | Age 16-19
COMPARE
Comanche
Serbian
In Labor Force | Age 16-19
In Labor Force | Age 16-19 Comparison
Comanche
Serbians
37.7%
IN LABOR FORCE | AGE 16-19
91.9/ 100
METRIC RATING
138th/ 347
METRIC RANK
39.9%
IN LABOR FORCE | AGE 16-19
99.9/ 100
METRIC RATING
71st/ 347
METRIC RANK
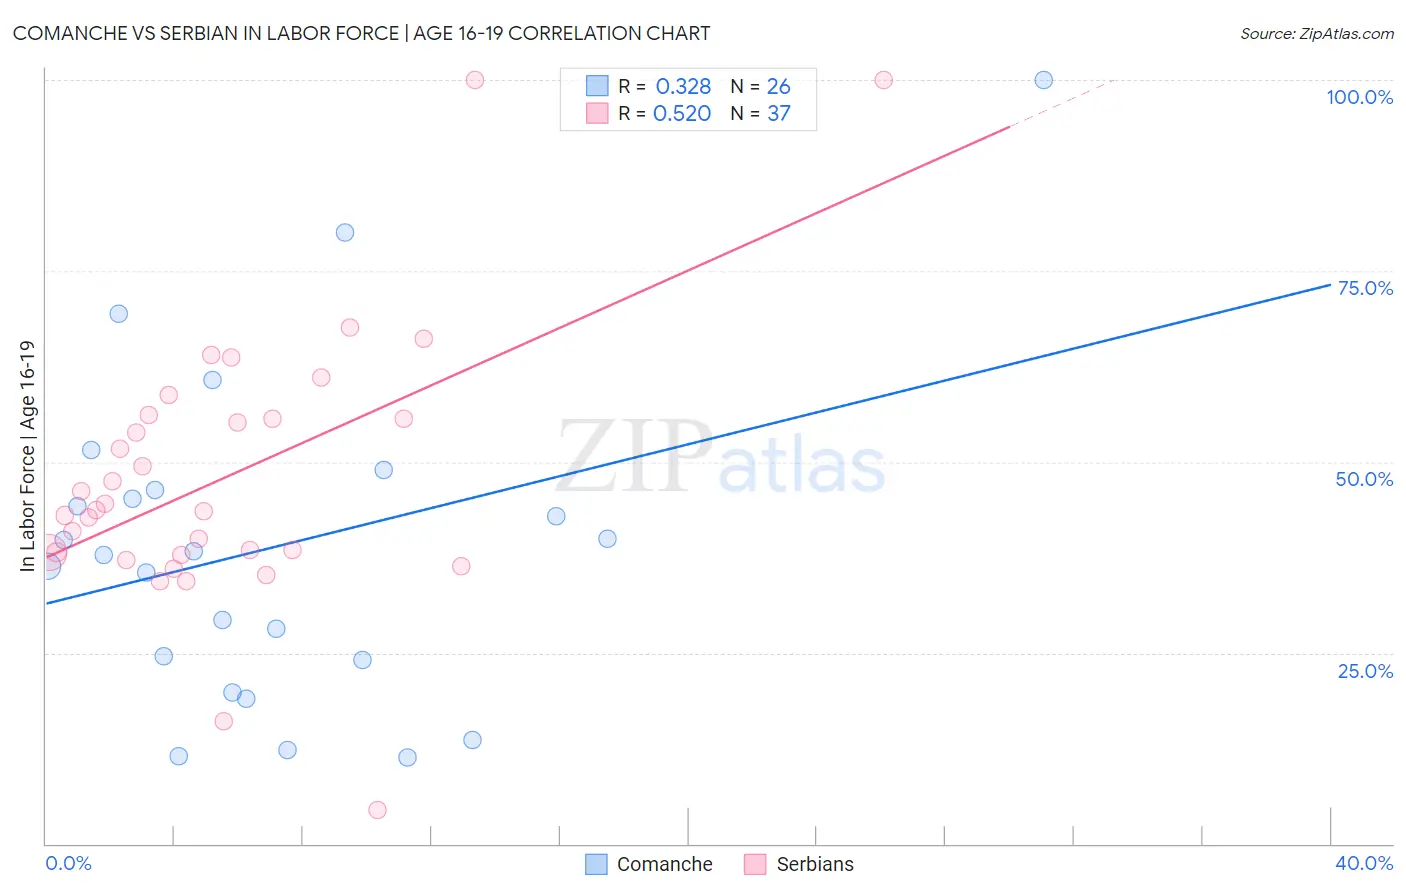
Comanche vs Serbian In Labor Force | Age 16-19 Correlation Chart
The statistical analysis conducted on geographies consisting of 109,736,088 people shows a mild positive correlation between the proportion of Comanche and labor force participation rate among population between the ages 16 and 19 in the United States with a correlation coefficient (R) of 0.328 and weighted average of 37.7%. Similarly, the statistical analysis conducted on geographies consisting of 267,337,384 people shows a substantial positive correlation between the proportion of Serbians and labor force participation rate among population between the ages 16 and 19 in the United States with a correlation coefficient (R) of 0.520 and weighted average of 39.9%, a difference of 6.0%.
In Labor Force | Age 16-19 Correlation Summary
| Measurement | Comanche | Serbian |
| Minimum | 11.3% | 4.4% |
| Maximum | 100.0% | 100.0% |
| Range | 88.7% | 95.6% |
| Mean | 38.8% | 48.0% |
| Median | 38.0% | 43.6% |
| Interquartile 25% (IQ1) | 24.0% | 37.9% |
| Interquartile 75% (IQ3) | 46.3% | 55.9% |
| Interquartile Range (IQR) | 22.3% | 18.0% |
| Standard Deviation (Sample) | 21.5% | 18.1% |
| Standard Deviation (Population) | 21.1% | 17.8% |
Similar Demographics by In Labor Force | Age 16-19
Demographics Similar to Comanche by In Labor Force | Age 16-19
In terms of in labor force | age 16-19, the demographic groups most similar to Comanche are Immigrants from Moldova (37.7%, a difference of 0.010%), Estonian (37.7%, a difference of 0.050%), Syrian (37.6%, a difference of 0.19%), Australian (37.8%, a difference of 0.23%), and Cajun (37.8%, a difference of 0.23%).
| Demographics | Rating | Rank | In Labor Force | Age 16-19 |
| Immigrants | Austria | 95.0 /100 | #131 | Exceptional 37.9% |
| Immigrants | Oceania | 94.7 /100 | #132 | Exceptional 37.9% |
| Cheyenne | 94.6 /100 | #133 | Exceptional 37.9% |
| Immigrants | Netherlands | 93.7 /100 | #134 | Exceptional 37.8% |
| Macedonians | 93.4 /100 | #135 | Exceptional 37.8% |
| Australians | 93.2 /100 | #136 | Exceptional 37.8% |
| Cajuns | 93.2 /100 | #137 | Exceptional 37.8% |
| Comanche | 91.9 /100 | #138 | Exceptional 37.7% |
| Immigrants | Moldova | 91.9 /100 | #139 | Exceptional 37.7% |
| Estonians | 91.7 /100 | #140 | Exceptional 37.7% |
| Syrians | 90.7 /100 | #141 | Exceptional 37.6% |
| Sierra Leoneans | 89.7 /100 | #142 | Excellent 37.6% |
| Pakistanis | 89.5 /100 | #143 | Excellent 37.6% |
| Japanese | 89.3 /100 | #144 | Excellent 37.5% |
| Paiute | 89.3 /100 | #145 | Excellent 37.5% |
Demographics Similar to Serbians by In Labor Force | Age 16-19
In terms of in labor force | age 16-19, the demographic groups most similar to Serbians are Iroquois (39.9%, a difference of 0.010%), Immigrants from Middle Africa (39.9%, a difference of 0.040%), Portuguese (40.0%, a difference of 0.17%), Potawatomi (40.0%, a difference of 0.22%), and Hungarian (39.8%, a difference of 0.27%).
| Demographics | Rating | Rank | In Labor Force | Age 16-19 |
| Immigrants | Micronesia | 100.0 /100 | #64 | Exceptional 40.2% |
| Kenyans | 100.0 /100 | #65 | Exceptional 40.1% |
| Immigrants | Nonimmigrants | 100.0 /100 | #66 | Exceptional 40.1% |
| Canadians | 100.0 /100 | #67 | Exceptional 40.1% |
| Italians | 99.9 /100 | #68 | Exceptional 40.1% |
| Potawatomi | 99.9 /100 | #69 | Exceptional 40.0% |
| Portuguese | 99.9 /100 | #70 | Exceptional 40.0% |
| Serbians | 99.9 /100 | #71 | Exceptional 39.9% |
| Iroquois | 99.9 /100 | #72 | Exceptional 39.9% |
| Immigrants | Middle Africa | 99.9 /100 | #73 | Exceptional 39.9% |
| Hungarians | 99.9 /100 | #74 | Exceptional 39.8% |
| French American Indians | 99.9 /100 | #75 | Exceptional 39.8% |
| Malaysians | 99.9 /100 | #76 | Exceptional 39.7% |
| Immigrants | Portugal | 99.9 /100 | #77 | Exceptional 39.7% |
| Austrians | 99.8 /100 | #78 | Exceptional 39.5% |