Comanche vs Northern European In Labor Force | Age 35-44
COMPARE
Comanche
Northern European
In Labor Force | Age 35-44
In Labor Force | Age 35-44 Comparison
Comanche
Northern Europeans
81.5%
IN LABOR FORCE | AGE 35-44
0.0/ 100
METRIC RATING
316th/ 347
METRIC RANK
84.3%
IN LABOR FORCE | AGE 35-44
44.1/ 100
METRIC RATING
178th/ 347
METRIC RANK
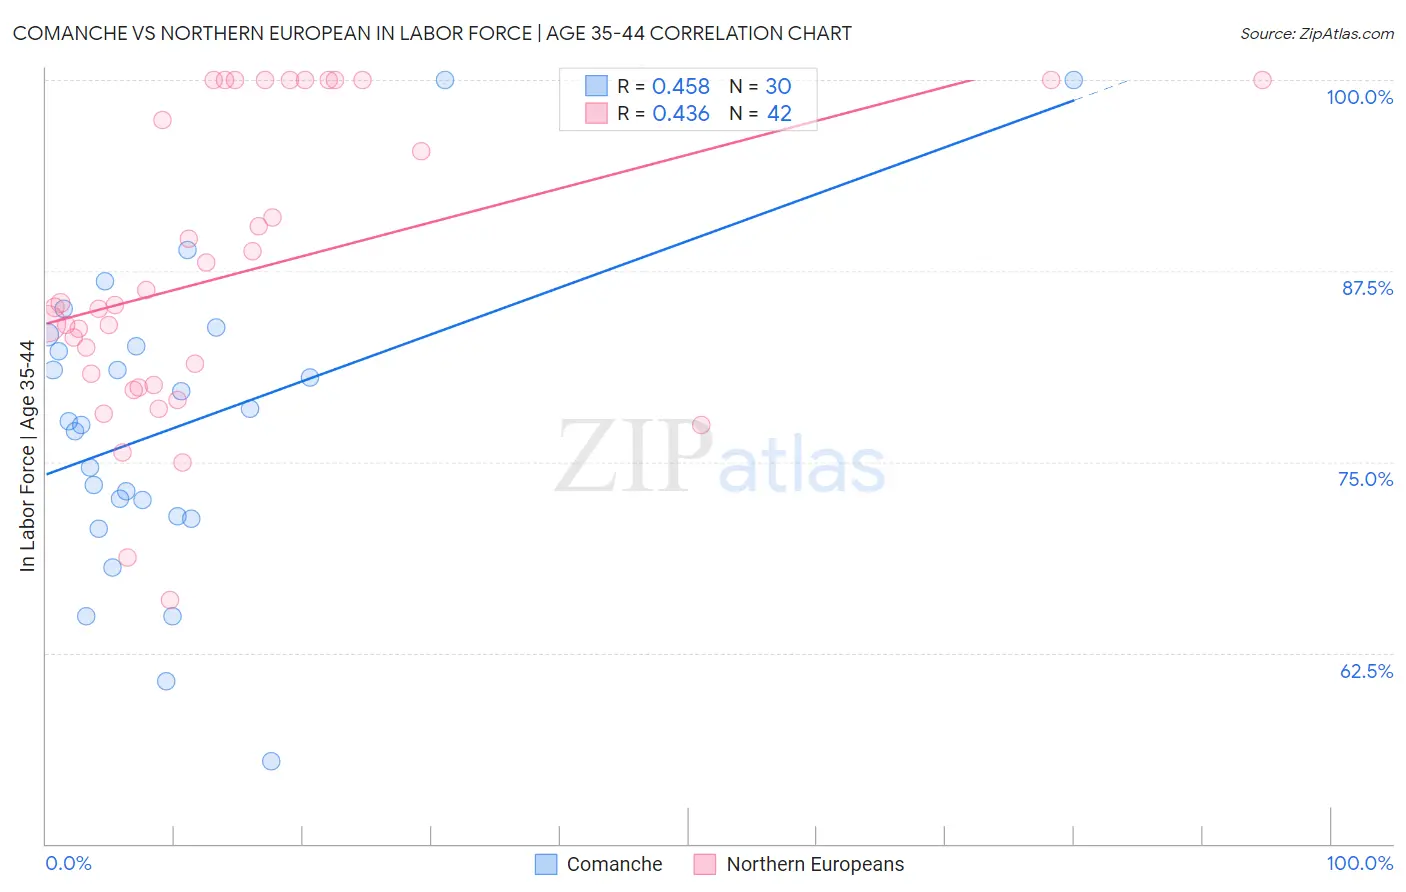
Comanche vs Northern European In Labor Force | Age 35-44 Correlation Chart
The statistical analysis conducted on geographies consisting of 109,773,192 people shows a moderate positive correlation between the proportion of Comanche and labor force participation rate among population between the ages 35 and 44 in the United States with a correlation coefficient (R) of 0.458 and weighted average of 81.5%. Similarly, the statistical analysis conducted on geographies consisting of 405,956,669 people shows a moderate positive correlation between the proportion of Northern Europeans and labor force participation rate among population between the ages 35 and 44 in the United States with a correlation coefficient (R) of 0.436 and weighted average of 84.3%, a difference of 3.5%.
In Labor Force | Age 35-44 Correlation Summary
| Measurement | Comanche | Northern European |
| Minimum | 55.4% | 66.0% |
| Maximum | 100.0% | 100.0% |
| Range | 44.6% | 34.0% |
| Mean | 77.3% | 87.4% |
| Median | 77.6% | 85.2% |
| Interquartile 25% (IQ1) | 71.4% | 80.1% |
| Interquartile 75% (IQ3) | 82.6% | 100.0% |
| Interquartile Range (IQR) | 11.2% | 19.9% |
| Standard Deviation (Sample) | 9.9% | 9.5% |
| Standard Deviation (Population) | 9.7% | 9.4% |
Similar Demographics by In Labor Force | Age 35-44
Demographics Similar to Comanche by In Labor Force | Age 35-44
In terms of in labor force | age 35-44, the demographic groups most similar to Comanche are Immigrants from Mexico (81.5%, a difference of 0.020%), Cajun (81.5%, a difference of 0.050%), Cherokee (81.4%, a difference of 0.080%), Alaska Native (81.6%, a difference of 0.16%), and Mexican (81.6%, a difference of 0.16%).
| Demographics | Rating | Rank | In Labor Force | Age 35-44 |
| Cree | 0.0 /100 | #309 | Tragic 82.0% |
| Blackfeet | 0.0 /100 | #310 | Tragic 81.9% |
| Colville | 0.0 /100 | #311 | Tragic 81.7% |
| Alaska Natives | 0.0 /100 | #312 | Tragic 81.6% |
| Mexicans | 0.0 /100 | #313 | Tragic 81.6% |
| Cajuns | 0.0 /100 | #314 | Tragic 81.5% |
| Immigrants | Mexico | 0.0 /100 | #315 | Tragic 81.5% |
| Comanche | 0.0 /100 | #316 | Tragic 81.5% |
| Cherokee | 0.0 /100 | #317 | Tragic 81.4% |
| Alaskan Athabascans | 0.0 /100 | #318 | Tragic 81.3% |
| Inupiat | 0.0 /100 | #319 | Tragic 80.9% |
| Chickasaw | 0.0 /100 | #320 | Tragic 80.9% |
| Puerto Ricans | 0.0 /100 | #321 | Tragic 80.7% |
| Paiute | 0.0 /100 | #322 | Tragic 80.6% |
| Yaqui | 0.0 /100 | #323 | Tragic 80.5% |
Demographics Similar to Northern Europeans by In Labor Force | Age 35-44
In terms of in labor force | age 35-44, the demographic groups most similar to Northern Europeans are French Canadian (84.3%, a difference of 0.0%), Immigrants from South Africa (84.3%, a difference of 0.010%), Sri Lankan (84.4%, a difference of 0.020%), Pakistani (84.4%, a difference of 0.030%), and Immigrants from Trinidad and Tobago (84.4%, a difference of 0.040%).
| Demographics | Rating | Rank | In Labor Force | Age 35-44 |
| Jordanians | 51.7 /100 | #171 | Average 84.4% |
| Scandinavians | 51.2 /100 | #172 | Average 84.4% |
| Immigrants | Trinidad and Tobago | 50.7 /100 | #173 | Average 84.4% |
| Immigrants | Iran | 50.0 /100 | #174 | Average 84.4% |
| Pakistanis | 48.2 /100 | #175 | Average 84.4% |
| Sri Lankans | 47.3 /100 | #176 | Average 84.4% |
| French Canadians | 44.3 /100 | #177 | Average 84.3% |
| Northern Europeans | 44.1 /100 | #178 | Average 84.3% |
| Immigrants | South Africa | 42.8 /100 | #179 | Average 84.3% |
| Danes | 38.8 /100 | #180 | Fair 84.3% |
| Immigrants | West Indies | 36.4 /100 | #181 | Fair 84.3% |
| Koreans | 36.3 /100 | #182 | Fair 84.3% |
| Barbadians | 36.2 /100 | #183 | Fair 84.3% |
| Armenians | 35.6 /100 | #184 | Fair 84.3% |
| Costa Ricans | 35.3 /100 | #185 | Fair 84.3% |