Comanche vs Lebanese In Labor Force | Age 35-44
COMPARE
Comanche
Lebanese
In Labor Force | Age 35-44
In Labor Force | Age 35-44 Comparison
Comanche
Lebanese
81.5%
IN LABOR FORCE | AGE 35-44
0.0/ 100
METRIC RATING
316th/ 347
METRIC RANK
83.6%
IN LABOR FORCE | AGE 35-44
0.4/ 100
METRIC RATING
253rd/ 347
METRIC RANK
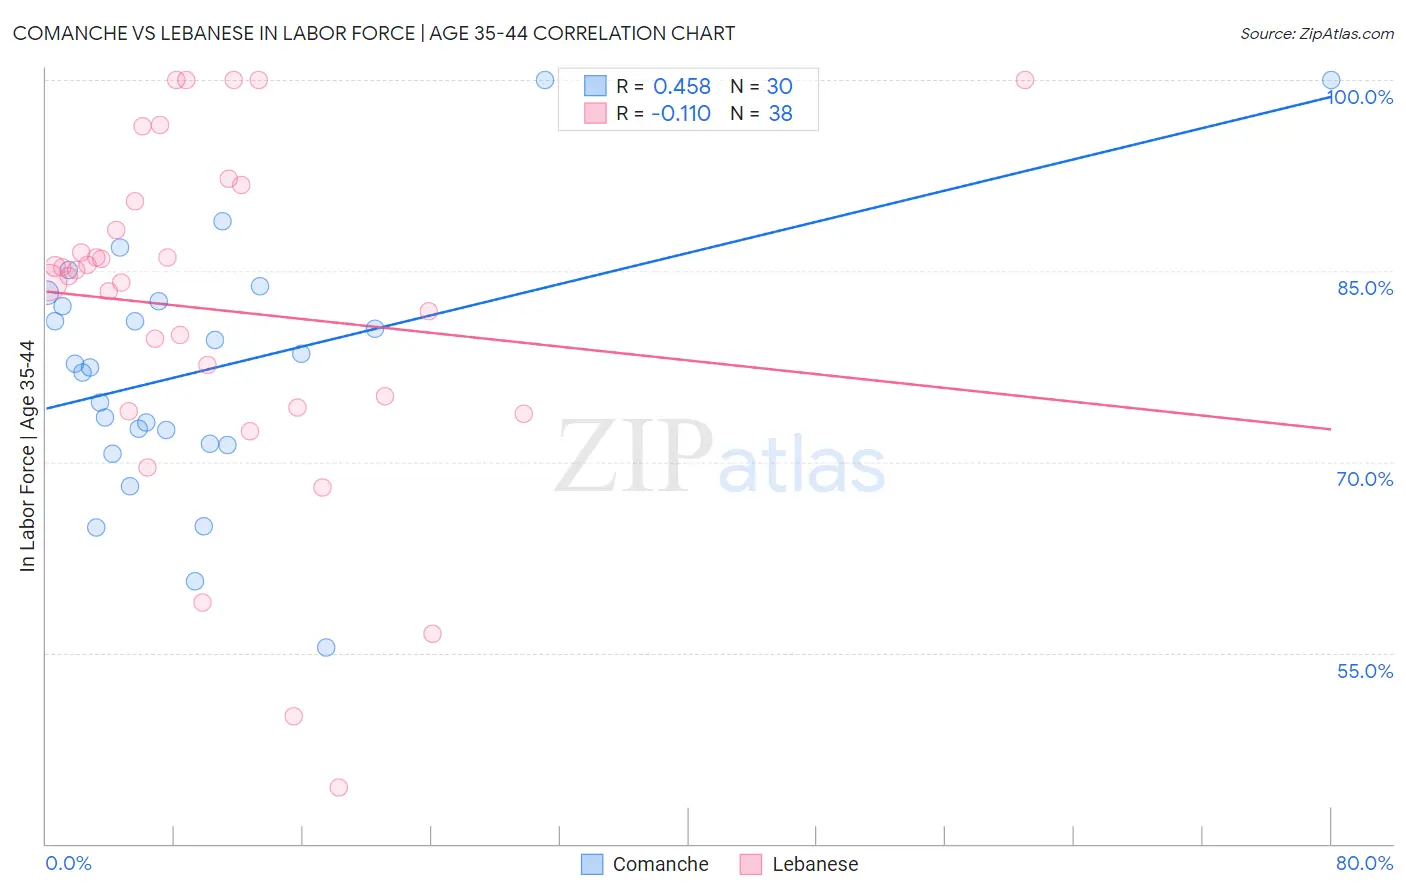
Comanche vs Lebanese In Labor Force | Age 35-44 Correlation Chart
The statistical analysis conducted on geographies consisting of 109,773,192 people shows a moderate positive correlation between the proportion of Comanche and labor force participation rate among population between the ages 35 and 44 in the United States with a correlation coefficient (R) of 0.458 and weighted average of 81.5%. Similarly, the statistical analysis conducted on geographies consisting of 401,370,132 people shows a poor negative correlation between the proportion of Lebanese and labor force participation rate among population between the ages 35 and 44 in the United States with a correlation coefficient (R) of -0.110 and weighted average of 83.6%, a difference of 2.6%.
In Labor Force | Age 35-44 Correlation Summary
| Measurement | Comanche | Lebanese |
| Minimum | 55.4% | 44.4% |
| Maximum | 100.0% | 100.0% |
| Range | 44.6% | 55.6% |
| Mean | 77.3% | 81.9% |
| Median | 77.6% | 84.8% |
| Interquartile 25% (IQ1) | 71.4% | 74.3% |
| Interquartile 75% (IQ3) | 82.6% | 90.5% |
| Interquartile Range (IQR) | 11.2% | 16.2% |
| Standard Deviation (Sample) | 9.9% | 13.6% |
| Standard Deviation (Population) | 9.7% | 13.4% |
Similar Demographics by In Labor Force | Age 35-44
Demographics Similar to Comanche by In Labor Force | Age 35-44
In terms of in labor force | age 35-44, the demographic groups most similar to Comanche are Immigrants from Mexico (81.5%, a difference of 0.020%), Cajun (81.5%, a difference of 0.050%), Cherokee (81.4%, a difference of 0.080%), Alaska Native (81.6%, a difference of 0.16%), and Mexican (81.6%, a difference of 0.16%).
| Demographics | Rating | Rank | In Labor Force | Age 35-44 |
| Cree | 0.0 /100 | #309 | Tragic 82.0% |
| Blackfeet | 0.0 /100 | #310 | Tragic 81.9% |
| Colville | 0.0 /100 | #311 | Tragic 81.7% |
| Alaska Natives | 0.0 /100 | #312 | Tragic 81.6% |
| Mexicans | 0.0 /100 | #313 | Tragic 81.6% |
| Cajuns | 0.0 /100 | #314 | Tragic 81.5% |
| Immigrants | Mexico | 0.0 /100 | #315 | Tragic 81.5% |
| Comanche | 0.0 /100 | #316 | Tragic 81.5% |
| Cherokee | 0.0 /100 | #317 | Tragic 81.4% |
| Alaskan Athabascans | 0.0 /100 | #318 | Tragic 81.3% |
| Inupiat | 0.0 /100 | #319 | Tragic 80.9% |
| Chickasaw | 0.0 /100 | #320 | Tragic 80.9% |
| Puerto Ricans | 0.0 /100 | #321 | Tragic 80.7% |
| Paiute | 0.0 /100 | #322 | Tragic 80.6% |
| Yaqui | 0.0 /100 | #323 | Tragic 80.5% |
Demographics Similar to Lebanese by In Labor Force | Age 35-44
In terms of in labor force | age 35-44, the demographic groups most similar to Lebanese are Salvadoran (83.6%, a difference of 0.0%), Immigrants from Guyana (83.6%, a difference of 0.0%), Tongan (83.6%, a difference of 0.010%), White/Caucasian (83.6%, a difference of 0.020%), and Immigrants from the Azores (83.6%, a difference of 0.040%).
| Demographics | Rating | Rank | In Labor Force | Age 35-44 |
| Immigrants | Immigrants | 1.0 /100 | #246 | Tragic 83.7% |
| Immigrants | Armenia | 0.9 /100 | #247 | Tragic 83.7% |
| Indonesians | 0.8 /100 | #248 | Tragic 83.7% |
| Immigrants | St. Vincent and the Grenadines | 0.7 /100 | #249 | Tragic 83.7% |
| Whites/Caucasians | 0.5 /100 | #250 | Tragic 83.6% |
| Salvadorans | 0.4 /100 | #251 | Tragic 83.6% |
| Immigrants | Guyana | 0.4 /100 | #252 | Tragic 83.6% |
| Lebanese | 0.4 /100 | #253 | Tragic 83.6% |
| Tongans | 0.4 /100 | #254 | Tragic 83.6% |
| Immigrants | Azores | 0.3 /100 | #255 | Tragic 83.6% |
| Japanese | 0.3 /100 | #256 | Tragic 83.6% |
| Basques | 0.3 /100 | #257 | Tragic 83.6% |
| Tsimshian | 0.2 /100 | #258 | Tragic 83.5% |
| Immigrants | El Salvador | 0.2 /100 | #259 | Tragic 83.5% |
| Vietnamese | 0.2 /100 | #260 | Tragic 83.5% |