Immigrants from Bosnia and Herzegovina vs Immigrants from Grenada In Labor Force | Age 30-34
COMPARE
Immigrants from Bosnia and Herzegovina
Immigrants from Grenada
In Labor Force | Age 30-34
In Labor Force | Age 30-34 Comparison
Immigrants from Bosnia and Herzegovina
Immigrants from Grenada
85.8%
IN LABOR FORCE | AGE 30-34
99.9/ 100
METRIC RATING
33rd/ 347
METRIC RANK
83.5%
IN LABOR FORCE | AGE 30-34
0.0/ 100
METRIC RATING
275th/ 347
METRIC RANK
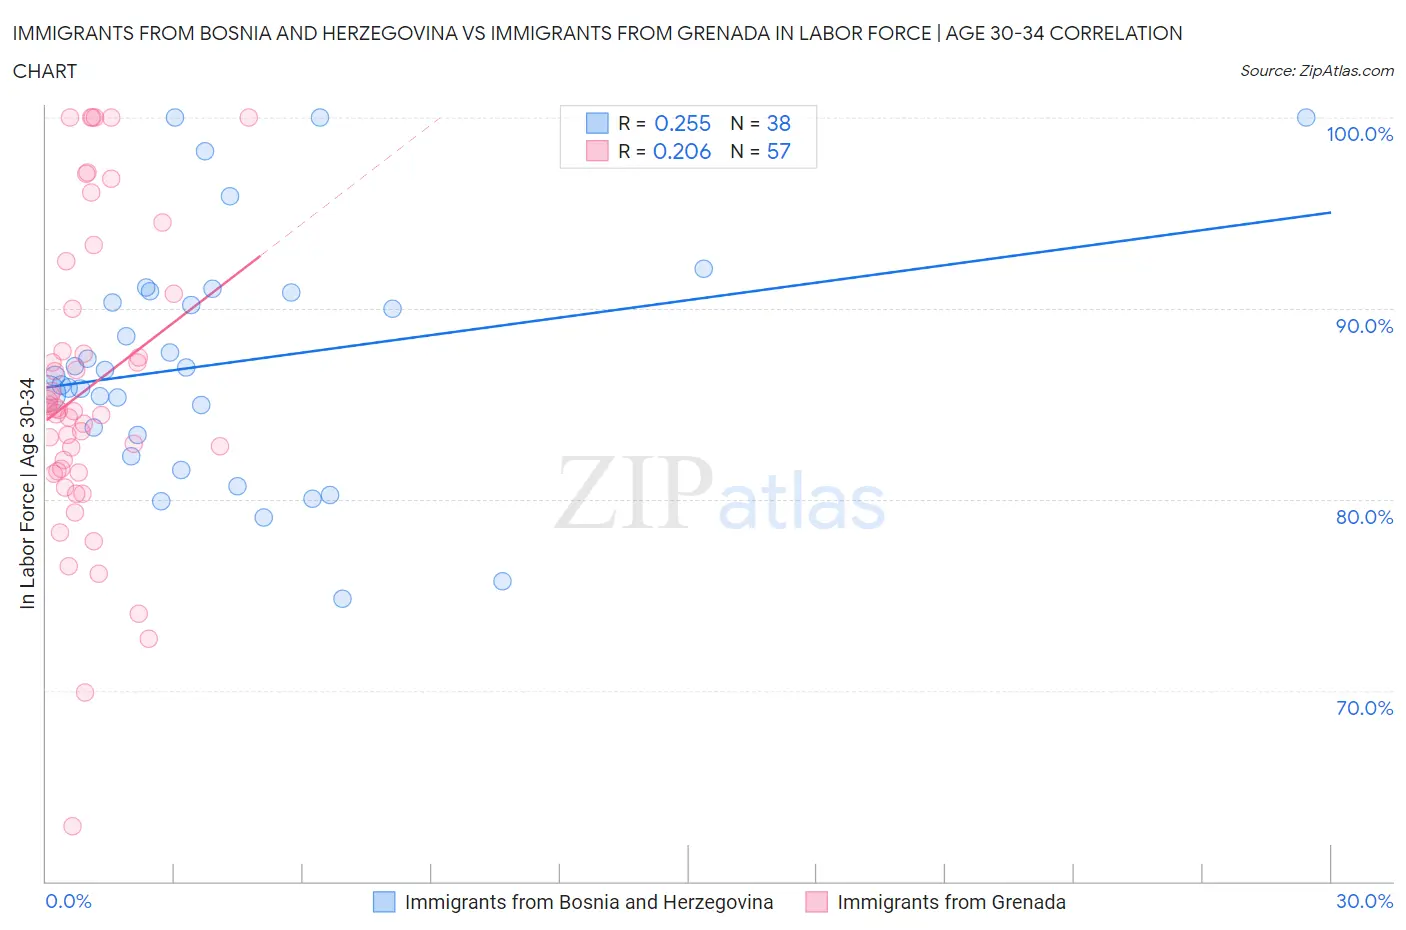
Immigrants from Bosnia and Herzegovina vs Immigrants from Grenada In Labor Force | Age 30-34 Correlation Chart
The statistical analysis conducted on geographies consisting of 156,800,912 people shows a weak positive correlation between the proportion of Immigrants from Bosnia and Herzegovina and labor force participation rate among population between the ages 30 and 34 in the United States with a correlation coefficient (R) of 0.255 and weighted average of 85.8%. Similarly, the statistical analysis conducted on geographies consisting of 67,171,211 people shows a weak positive correlation between the proportion of Immigrants from Grenada and labor force participation rate among population between the ages 30 and 34 in the United States with a correlation coefficient (R) of 0.206 and weighted average of 83.5%, a difference of 2.7%.
In Labor Force | Age 30-34 Correlation Summary
| Measurement | Immigrants from Bosnia and Herzegovina | Immigrants from Grenada |
| Minimum | 74.8% | 62.9% |
| Maximum | 100.0% | 100.0% |
| Range | 25.2% | 37.1% |
| Mean | 87.1% | 85.8% |
| Median | 86.6% | 84.7% |
| Interquartile 25% (IQ1) | 83.4% | 81.4% |
| Interquartile 75% (IQ3) | 90.8% | 90.4% |
| Interquartile Range (IQR) | 7.5% | 9.0% |
| Standard Deviation (Sample) | 6.3% | 8.0% |
| Standard Deviation (Population) | 6.2% | 7.9% |
Similar Demographics by In Labor Force | Age 30-34
Demographics Similar to Immigrants from Bosnia and Herzegovina by In Labor Force | Age 30-34
In terms of in labor force | age 30-34, the demographic groups most similar to Immigrants from Bosnia and Herzegovina are Ugandan (85.8%, a difference of 0.0%), Serbian (85.8%, a difference of 0.010%), Albanian (85.7%, a difference of 0.010%), Norwegian (85.7%, a difference of 0.020%), and Immigrants from Greece (85.7%, a difference of 0.030%).
| Demographics | Rating | Rank | In Labor Force | Age 30-34 |
| Immigrants | Eastern Africa | 100.0 /100 | #26 | Exceptional 85.9% |
| Immigrants | Liberia | 100.0 /100 | #27 | Exceptional 85.9% |
| Immigrants | Latvia | 100.0 /100 | #28 | Exceptional 85.9% |
| Tsimshian | 100.0 /100 | #29 | Exceptional 85.8% |
| Immigrants | Hong Kong | 100.0 /100 | #30 | Exceptional 85.8% |
| Paraguayans | 99.9 /100 | #31 | Exceptional 85.8% |
| Cypriots | 99.9 /100 | #32 | Exceptional 85.8% |
| Immigrants | Bosnia and Herzegovina | 99.9 /100 | #33 | Exceptional 85.8% |
| Ugandans | 99.9 /100 | #34 | Exceptional 85.8% |
| Serbians | 99.9 /100 | #35 | Exceptional 85.8% |
| Albanians | 99.9 /100 | #36 | Exceptional 85.7% |
| Norwegians | 99.9 /100 | #37 | Exceptional 85.7% |
| Immigrants | Greece | 99.9 /100 | #38 | Exceptional 85.7% |
| Eastern Europeans | 99.9 /100 | #39 | Exceptional 85.7% |
| Turks | 99.9 /100 | #40 | Exceptional 85.7% |
Demographics Similar to Immigrants from Grenada by In Labor Force | Age 30-34
In terms of in labor force | age 30-34, the demographic groups most similar to Immigrants from Grenada are Belizean (83.5%, a difference of 0.010%), Tongan (83.5%, a difference of 0.010%), Guamanian/Chamorro (83.5%, a difference of 0.020%), Delaware (83.5%, a difference of 0.030%), and Spanish (83.5%, a difference of 0.070%).
| Demographics | Rating | Rank | In Labor Force | Age 30-34 |
| Immigrants | Bangladesh | 0.1 /100 | #268 | Tragic 83.6% |
| Vietnamese | 0.1 /100 | #269 | Tragic 83.6% |
| Spanish Americans | 0.0 /100 | #270 | Tragic 83.5% |
| Spanish | 0.0 /100 | #271 | Tragic 83.5% |
| Immigrants | Nonimmigrants | 0.0 /100 | #272 | Tragic 83.5% |
| Guamanians/Chamorros | 0.0 /100 | #273 | Tragic 83.5% |
| Belizeans | 0.0 /100 | #274 | Tragic 83.5% |
| Immigrants | Grenada | 0.0 /100 | #275 | Tragic 83.5% |
| Tongans | 0.0 /100 | #276 | Tragic 83.5% |
| Delaware | 0.0 /100 | #277 | Tragic 83.5% |
| Fijians | 0.0 /100 | #278 | Tragic 83.4% |
| Immigrants | Fiji | 0.0 /100 | #279 | Tragic 83.4% |
| Africans | 0.0 /100 | #280 | Tragic 83.4% |
| Samoans | 0.0 /100 | #281 | Tragic 83.3% |
| Mexican American Indians | 0.0 /100 | #282 | Tragic 83.2% |