Colville vs Pakistani Median Male Earnings
COMPARE
Colville
Pakistani
Median Male Earnings
Median Male Earnings Comparison
Colville
Pakistanis
$48,516
MEDIAN MALE EARNINGS
0.3/ 100
METRIC RATING
274th/ 347
METRIC RANK
$56,719
MEDIAN MALE EARNINGS
89.9/ 100
METRIC RATING
129th/ 347
METRIC RANK
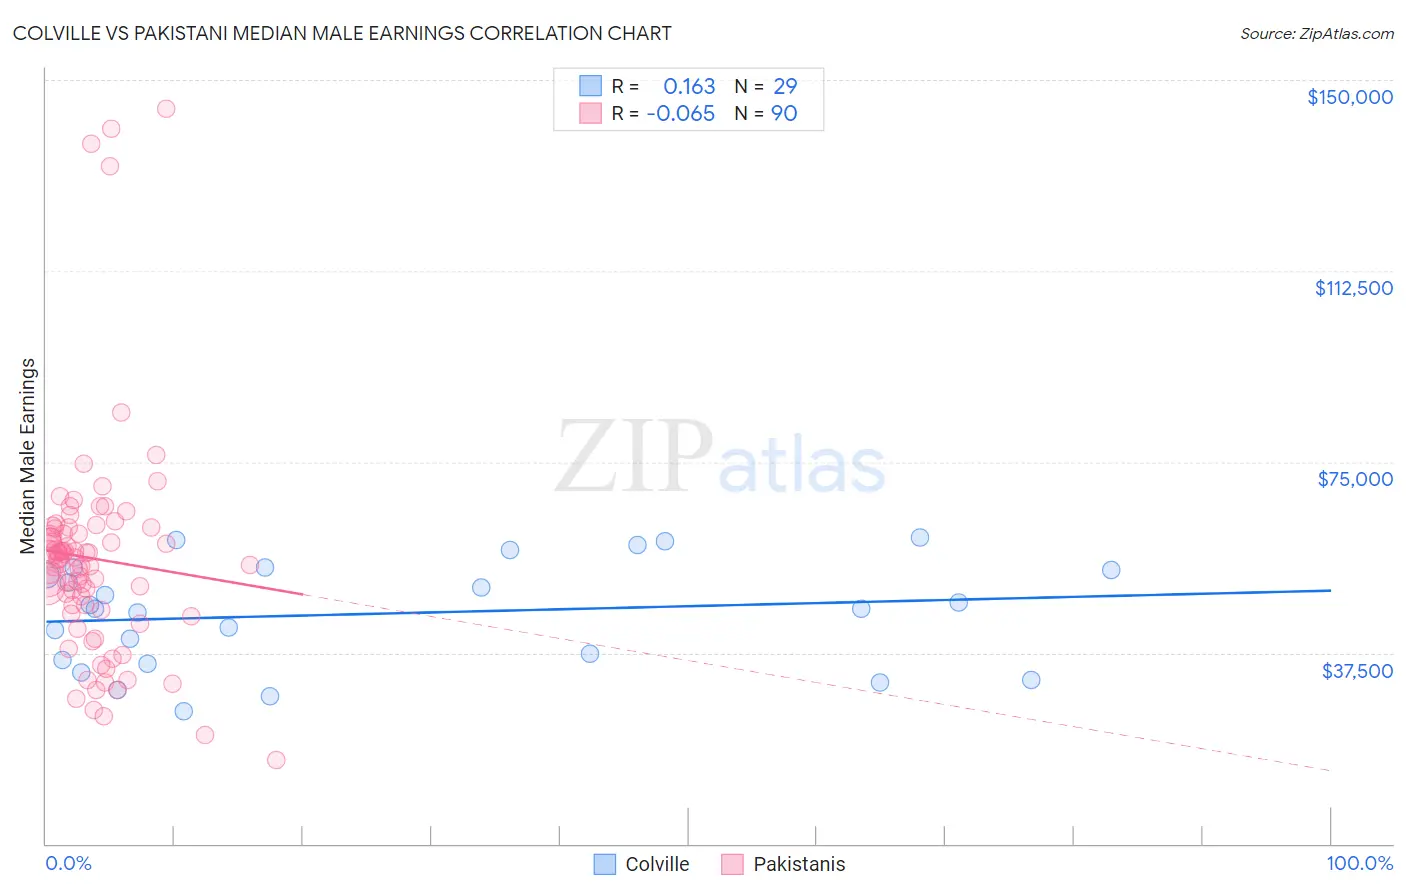
Colville vs Pakistani Median Male Earnings Correlation Chart
The statistical analysis conducted on geographies consisting of 34,680,141 people shows a poor positive correlation between the proportion of Colville and median male earnings in the United States with a correlation coefficient (R) of 0.163 and weighted average of $48,516. Similarly, the statistical analysis conducted on geographies consisting of 335,324,155 people shows a slight negative correlation between the proportion of Pakistanis and median male earnings in the United States with a correlation coefficient (R) of -0.065 and weighted average of $56,719, a difference of 16.9%.
Median Male Earnings Correlation Summary
| Measurement | Colville | Pakistani |
| Minimum | $26,071 | $16,406 |
| Maximum | $60,184 | $144,236 |
| Range | $34,113 | $127,830 |
| Mean | $45,174 | $56,003 |
| Median | $46,167 | $55,878 |
| Interquartile 25% (IQ1) | $35,723 | $45,960 |
| Interquartile 75% (IQ3) | $54,047 | $61,933 |
| Interquartile Range (IQR) | $18,325 | $15,973 |
| Standard Deviation (Sample) | $10,311 | $22,100 |
| Standard Deviation (Population) | $10,132 | $21,977 |
Similar Demographics by Median Male Earnings
Demographics Similar to Colville by Median Male Earnings
In terms of median male earnings, the demographic groups most similar to Colville are Immigrants from Somalia ($48,439, a difference of 0.16%), Jamaican ($48,632, a difference of 0.24%), Blackfeet ($48,402, a difference of 0.24%), Salvadoran ($48,646, a difference of 0.27%), and Cherokee ($48,669, a difference of 0.32%).
| Demographics | Rating | Rank | Median Male Earnings |
| Spanish Americans | 0.5 /100 | #267 | Tragic $49,008 |
| Ute | 0.4 /100 | #268 | Tragic $48,899 |
| Tsimshian | 0.4 /100 | #269 | Tragic $48,836 |
| Potawatomi | 0.4 /100 | #270 | Tragic $48,768 |
| Cherokee | 0.3 /100 | #271 | Tragic $48,669 |
| Salvadorans | 0.3 /100 | #272 | Tragic $48,646 |
| Jamaicans | 0.3 /100 | #273 | Tragic $48,632 |
| Colville | 0.3 /100 | #274 | Tragic $48,516 |
| Immigrants | Somalia | 0.3 /100 | #275 | Tragic $48,439 |
| Blackfeet | 0.3 /100 | #276 | Tragic $48,402 |
| Belizeans | 0.2 /100 | #277 | Tragic $48,358 |
| Immigrants | Liberia | 0.2 /100 | #278 | Tragic $48,317 |
| Hmong | 0.2 /100 | #279 | Tragic $48,254 |
| Comanche | 0.2 /100 | #280 | Tragic $48,202 |
| Marshallese | 0.2 /100 | #281 | Tragic $48,137 |
Demographics Similar to Pakistanis by Median Male Earnings
In terms of median male earnings, the demographic groups most similar to Pakistanis are Korean ($56,672, a difference of 0.080%), Portuguese ($56,663, a difference of 0.10%), Immigrants from Syria ($56,830, a difference of 0.20%), Brazilian ($56,837, a difference of 0.21%), and Chinese ($56,872, a difference of 0.27%).
| Demographics | Rating | Rank | Median Male Earnings |
| Immigrants | Jordan | 93.1 /100 | #122 | Exceptional $57,145 |
| Slovenes | 93.1 /100 | #123 | Exceptional $57,145 |
| Chileans | 91.9 /100 | #124 | Exceptional $56,973 |
| Immigrants | Morocco | 91.8 /100 | #125 | Exceptional $56,958 |
| Chinese | 91.1 /100 | #126 | Exceptional $56,872 |
| Brazilians | 90.9 /100 | #127 | Exceptional $56,837 |
| Immigrants | Syria | 90.8 /100 | #128 | Exceptional $56,830 |
| Pakistanis | 89.9 /100 | #129 | Excellent $56,719 |
| Koreans | 89.4 /100 | #130 | Excellent $56,672 |
| Portuguese | 89.4 /100 | #131 | Excellent $56,663 |
| Czechs | 88.2 /100 | #132 | Excellent $56,546 |
| Immigrants | Germany | 88.2 /100 | #133 | Excellent $56,542 |
| Moroccans | 87.7 /100 | #134 | Excellent $56,499 |
| Irish | 87.4 /100 | #135 | Excellent $56,464 |
| Immigrants | Saudi Arabia | 87.2 /100 | #136 | Excellent $56,452 |