Colville vs Aleut In Labor Force | Age > 16
COMPARE
Colville
Aleut
In Labor Force | Age > 16
In Labor Force | Age > 16 Comparison
Colville
Aleuts
59.8%
IN LABOR FORCE | AGE > 16
0.0/ 100
METRIC RATING
337th/ 347
METRIC RANK
66.0%
IN LABOR FORCE | AGE > 16
99.1/ 100
METRIC RATING
92nd/ 347
METRIC RANK
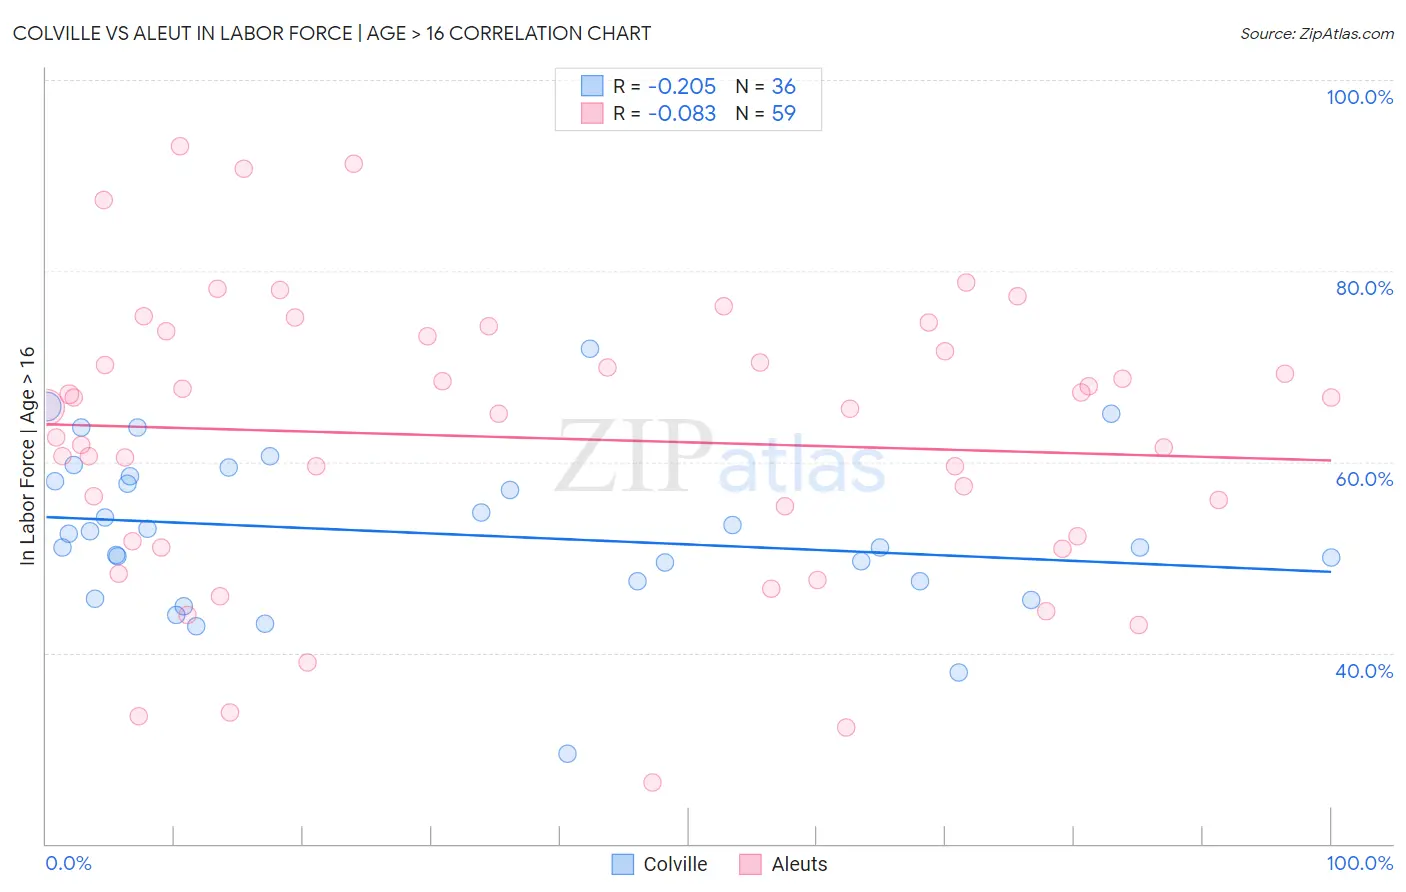
Colville vs Aleut In Labor Force | Age > 16 Correlation Chart
The statistical analysis conducted on geographies consisting of 34,687,961 people shows a weak negative correlation between the proportion of Colville and labor force participation rate among population ages 16 and over in the United States with a correlation coefficient (R) of -0.205 and weighted average of 59.8%. Similarly, the statistical analysis conducted on geographies consisting of 61,782,890 people shows a slight negative correlation between the proportion of Aleuts and labor force participation rate among population ages 16 and over in the United States with a correlation coefficient (R) of -0.083 and weighted average of 66.0%, a difference of 10.3%.
In Labor Force | Age > 16 Correlation Summary
| Measurement | Colville | Aleut |
| Minimum | 29.4% | 26.4% |
| Maximum | 71.9% | 93.1% |
| Range | 42.5% | 66.7% |
| Mean | 52.5% | 62.5% |
| Median | 51.7% | 65.5% |
| Interquartile 25% (IQ1) | 47.5% | 51.7% |
| Interquartile 75% (IQ3) | 58.2% | 73.1% |
| Interquartile Range (IQR) | 10.7% | 21.4% |
| Standard Deviation (Sample) | 8.4% | 14.9% |
| Standard Deviation (Population) | 8.3% | 14.8% |
Similar Demographics by In Labor Force | Age > 16
Demographics Similar to Colville by In Labor Force | Age > 16
In terms of in labor force | age > 16, the demographic groups most similar to Colville are Immigrants from Yemen (59.6%, a difference of 0.27%), Houma (59.5%, a difference of 0.52%), Pueblo (59.3%, a difference of 0.92%), Menominee (60.6%, a difference of 1.3%), and Native/Alaskan (60.6%, a difference of 1.3%).
| Demographics | Rating | Rank | In Labor Force | Age > 16 |
| Creek | 0.0 /100 | #330 | Tragic 61.3% |
| Ute | 0.0 /100 | #331 | Tragic 60.9% |
| Crow | 0.0 /100 | #332 | Tragic 60.8% |
| Paiute | 0.0 /100 | #333 | Tragic 60.7% |
| Apache | 0.0 /100 | #334 | Tragic 60.7% |
| Natives/Alaskans | 0.0 /100 | #335 | Tragic 60.6% |
| Menominee | 0.0 /100 | #336 | Tragic 60.6% |
| Colville | 0.0 /100 | #337 | Tragic 59.8% |
| Immigrants | Yemen | 0.0 /100 | #338 | Tragic 59.6% |
| Houma | 0.0 /100 | #339 | Tragic 59.5% |
| Pueblo | 0.0 /100 | #340 | Tragic 59.3% |
| Hopi | 0.0 /100 | #341 | Tragic 58.4% |
| Puerto Ricans | 0.0 /100 | #342 | Tragic 58.1% |
| Yuman | 0.0 /100 | #343 | Tragic 57.8% |
| Pima | 0.0 /100 | #344 | Tragic 57.4% |
Demographics Similar to Aleuts by In Labor Force | Age > 16
In terms of in labor force | age > 16, the demographic groups most similar to Aleuts are Immigrants from South America (66.0%, a difference of 0.010%), Iranian (66.0%, a difference of 0.020%), Immigrants from Cambodia (66.0%, a difference of 0.020%), Immigrants from Uruguay (66.0%, a difference of 0.020%), and Immigrants from Laos (66.0%, a difference of 0.030%).
| Demographics | Rating | Rank | In Labor Force | Age > 16 |
| Mongolians | 99.4 /100 | #85 | Exceptional 66.1% |
| South Americans | 99.4 /100 | #86 | Exceptional 66.0% |
| South American Indians | 99.4 /100 | #87 | Exceptional 66.0% |
| Bermudans | 99.3 /100 | #88 | Exceptional 66.0% |
| Immigrants | Laos | 99.2 /100 | #89 | Exceptional 66.0% |
| Chileans | 99.2 /100 | #90 | Exceptional 66.0% |
| Iranians | 99.2 /100 | #91 | Exceptional 66.0% |
| Aleuts | 99.1 /100 | #92 | Exceptional 66.0% |
| Immigrants | South America | 99.1 /100 | #93 | Exceptional 66.0% |
| Immigrants | Cambodia | 99.1 /100 | #94 | Exceptional 66.0% |
| Immigrants | Uruguay | 99.1 /100 | #95 | Exceptional 66.0% |
| Bangladeshis | 98.9 /100 | #96 | Exceptional 65.9% |
| Filipinos | 98.9 /100 | #97 | Exceptional 65.9% |
| Immigrants | Chile | 98.7 /100 | #98 | Exceptional 65.9% |
| Immigrants | Australia | 98.7 /100 | #99 | Exceptional 65.9% |