Iroquois vs West Indian In Labor Force | Age 25-29
COMPARE
Iroquois
West Indian
In Labor Force | Age 25-29
In Labor Force | Age 25-29 Comparison
Iroquois
West Indians
83.8%
IN LABOR FORCE | AGE 25-29
0.4/ 100
METRIC RATING
245th/ 347
METRIC RANK
83.5%
IN LABOR FORCE | AGE 25-29
0.1/ 100
METRIC RATING
263rd/ 347
METRIC RANK
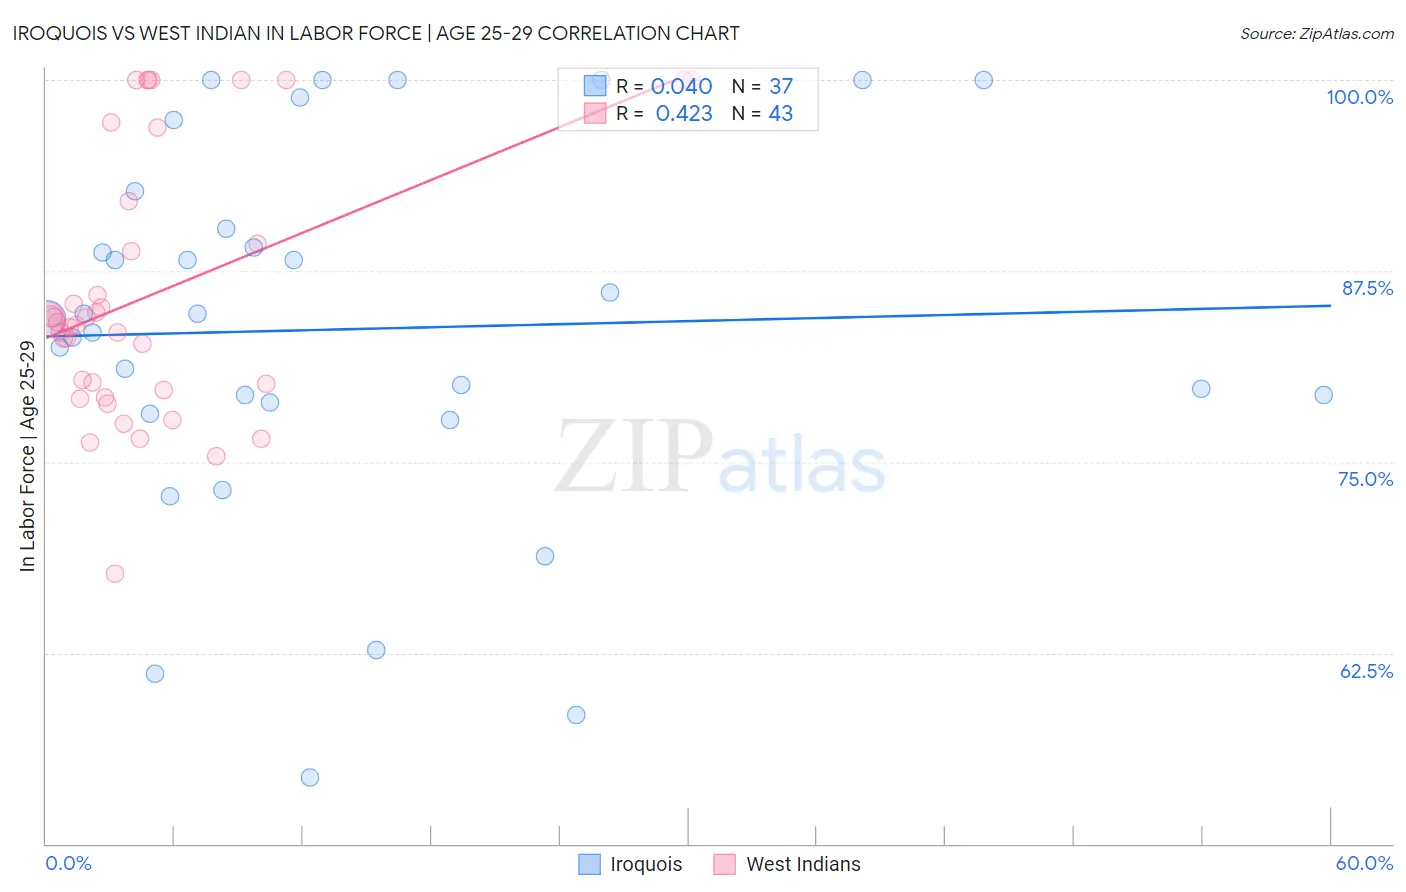
Iroquois vs West Indian In Labor Force | Age 25-29 Correlation Chart
The statistical analysis conducted on geographies consisting of 207,267,348 people shows no correlation between the proportion of Iroquois and labor force participation rate among population between the ages 25 and 29 in the United States with a correlation coefficient (R) of 0.040 and weighted average of 83.8%. Similarly, the statistical analysis conducted on geographies consisting of 254,002,174 people shows a moderate positive correlation between the proportion of West Indians and labor force participation rate among population between the ages 25 and 29 in the United States with a correlation coefficient (R) of 0.423 and weighted average of 83.5%, a difference of 0.33%.
In Labor Force | Age 25-29 Correlation Summary
| Measurement | Iroquois | West Indian |
| Minimum | 54.3% | 67.7% |
| Maximum | 100.0% | 100.0% |
| Range | 45.7% | 32.3% |
| Mean | 83.7% | 86.0% |
| Median | 84.4% | 84.2% |
| Interquartile 25% (IQ1) | 78.5% | 79.7% |
| Interquartile 75% (IQ3) | 91.5% | 92.1% |
| Interquartile Range (IQR) | 13.0% | 12.4% |
| Standard Deviation (Sample) | 12.2% | 8.6% |
| Standard Deviation (Population) | 12.0% | 8.5% |
Demographics Similar to Iroquois and West Indians by In Labor Force | Age 25-29
In terms of in labor force | age 25-29, the demographic groups most similar to Iroquois are Immigrants from Jamaica (83.8%, a difference of 0.0%), Cree (83.8%, a difference of 0.050%), Immigrants from El Salvador (83.7%, a difference of 0.070%), Nonimmigrants (83.7%, a difference of 0.080%), and Hmong (83.7%, a difference of 0.090%). Similarly, the demographic groups most similar to West Indians are Immigrants from Fiji (83.6%, a difference of 0.040%), Puget Sound Salish (83.5%, a difference of 0.060%), Immigrants from Bahamas (83.6%, a difference of 0.11%), Pennsylvania German (83.6%, a difference of 0.11%), and Spanish (83.6%, a difference of 0.12%).
| Demographics | Rating | Rank | In Labor Force | Age 25-29 |
| Immigrants | Jamaica | 0.4 /100 | #244 | Tragic 83.8% |
| Iroquois | 0.4 /100 | #245 | Tragic 83.8% |
| Cree | 0.3 /100 | #246 | Tragic 83.8% |
| Immigrants | El Salvador | 0.3 /100 | #247 | Tragic 83.7% |
| Immigrants | Nonimmigrants | 0.3 /100 | #248 | Tragic 83.7% |
| Hmong | 0.3 /100 | #249 | Tragic 83.7% |
| Central Americans | 0.2 /100 | #250 | Tragic 83.7% |
| Bahamians | 0.2 /100 | #251 | Tragic 83.7% |
| Guatemalans | 0.2 /100 | #252 | Tragic 83.7% |
| Immigrants | Trinidad and Tobago | 0.2 /100 | #253 | Tragic 83.7% |
| Spaniards | 0.2 /100 | #254 | Tragic 83.7% |
| Haitians | 0.2 /100 | #255 | Tragic 83.7% |
| Immigrants | Haiti | 0.2 /100 | #256 | Tragic 83.7% |
| Delaware | 0.2 /100 | #257 | Tragic 83.7% |
| Immigrants | Guatemala | 0.1 /100 | #258 | Tragic 83.6% |
| Spanish | 0.1 /100 | #259 | Tragic 83.6% |
| Immigrants | Bahamas | 0.1 /100 | #260 | Tragic 83.6% |
| Pennsylvania Germans | 0.1 /100 | #261 | Tragic 83.6% |
| Immigrants | Fiji | 0.1 /100 | #262 | Tragic 83.6% |
| West Indians | 0.1 /100 | #263 | Tragic 83.5% |
| Puget Sound Salish | 0.1 /100 | #264 | Tragic 83.5% |