Syrian vs West Indian In Labor Force | Age 25-29
COMPARE
Syrian
West Indian
In Labor Force | Age 25-29
In Labor Force | Age 25-29 Comparison
Syrians
West Indians
84.8%
IN LABOR FORCE | AGE 25-29
76.5/ 100
METRIC RATING
134th/ 347
METRIC RANK
83.5%
IN LABOR FORCE | AGE 25-29
0.1/ 100
METRIC RATING
263rd/ 347
METRIC RANK
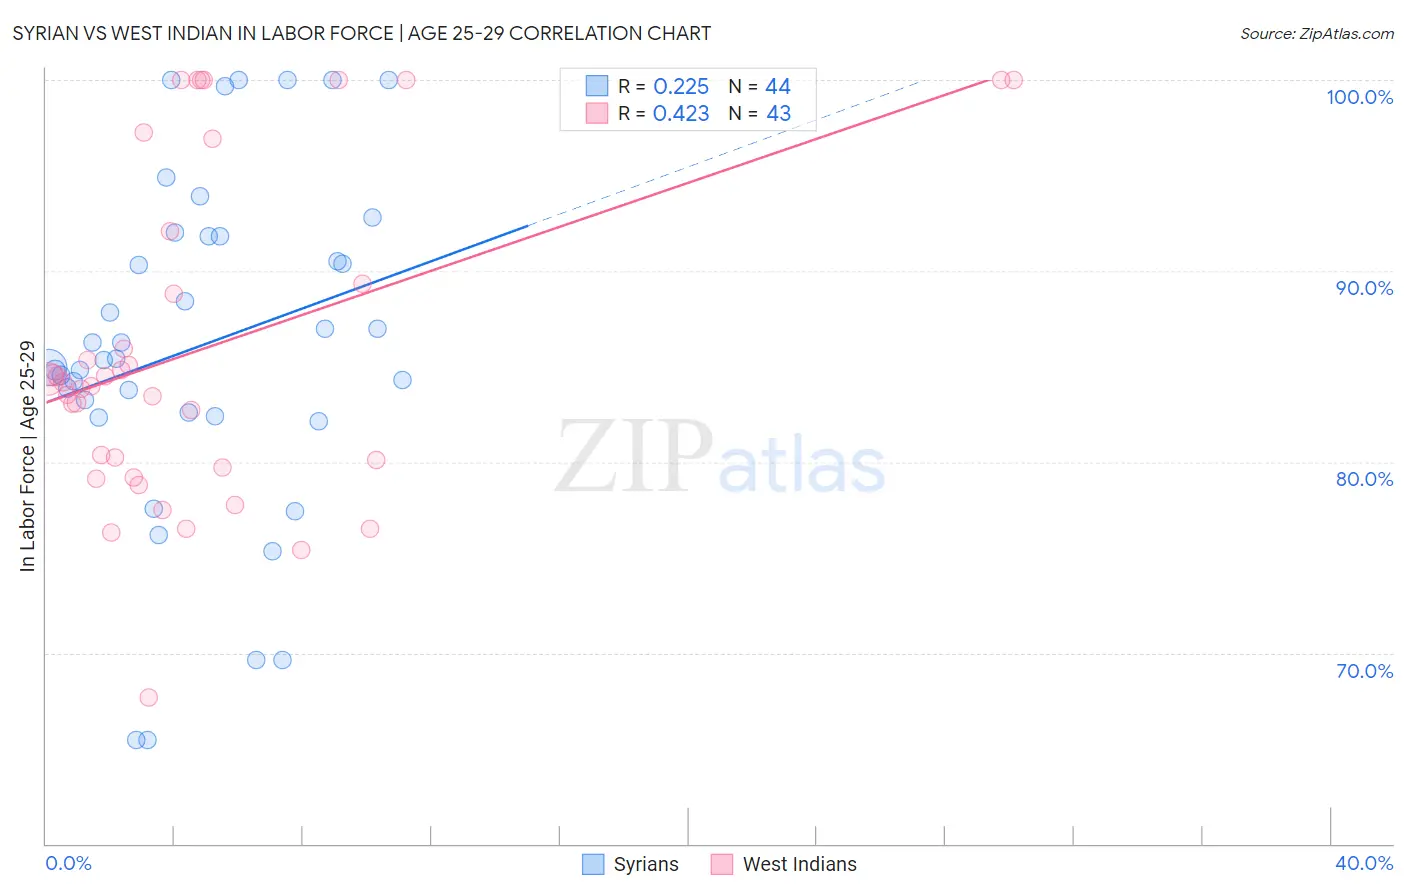
Syrian vs West Indian In Labor Force | Age 25-29 Correlation Chart
The statistical analysis conducted on geographies consisting of 266,239,805 people shows a weak positive correlation between the proportion of Syrians and labor force participation rate among population between the ages 25 and 29 in the United States with a correlation coefficient (R) of 0.225 and weighted average of 84.8%. Similarly, the statistical analysis conducted on geographies consisting of 254,002,174 people shows a moderate positive correlation between the proportion of West Indians and labor force participation rate among population between the ages 25 and 29 in the United States with a correlation coefficient (R) of 0.423 and weighted average of 83.5%, a difference of 1.6%.
In Labor Force | Age 25-29 Correlation Summary
| Measurement | Syrian | West Indian |
| Minimum | 65.4% | 67.7% |
| Maximum | 100.0% | 100.0% |
| Range | 34.6% | 32.3% |
| Mean | 86.0% | 86.0% |
| Median | 85.4% | 84.2% |
| Interquartile 25% (IQ1) | 82.5% | 79.7% |
| Interquartile 75% (IQ3) | 91.8% | 92.1% |
| Interquartile Range (IQR) | 9.3% | 12.4% |
| Standard Deviation (Sample) | 8.8% | 8.6% |
| Standard Deviation (Population) | 8.7% | 8.5% |
Similar Demographics by In Labor Force | Age 25-29
Demographics Similar to Syrians by In Labor Force | Age 25-29
In terms of in labor force | age 25-29, the demographic groups most similar to Syrians are Immigrants from Hungary (84.8%, a difference of 0.0%), Romanian (84.8%, a difference of 0.010%), Asian (84.8%, a difference of 0.010%), Bhutanese (84.8%, a difference of 0.010%), and Iranian (84.8%, a difference of 0.020%).
| Demographics | Rating | Rank | In Labor Force | Age 25-29 |
| Immigrants | Uruguay | 84.0 /100 | #127 | Excellent 84.9% |
| Australians | 83.6 /100 | #128 | Excellent 84.9% |
| Immigrants | Russia | 81.6 /100 | #129 | Excellent 84.9% |
| Northern Europeans | 81.3 /100 | #130 | Excellent 84.9% |
| Iranians | 78.1 /100 | #131 | Good 84.8% |
| Romanians | 77.7 /100 | #132 | Good 84.8% |
| Asians | 77.7 /100 | #133 | Good 84.8% |
| Syrians | 76.5 /100 | #134 | Good 84.8% |
| Immigrants | Hungary | 76.4 /100 | #135 | Good 84.8% |
| Bhutanese | 76.0 /100 | #136 | Good 84.8% |
| Immigrants | Canada | 73.5 /100 | #137 | Good 84.8% |
| Armenians | 72.7 /100 | #138 | Good 84.8% |
| Immigrants | Eastern Asia | 72.6 /100 | #139 | Good 84.8% |
| Immigrants | North America | 72.1 /100 | #140 | Good 84.8% |
| Danes | 71.9 /100 | #141 | Good 84.8% |
Demographics Similar to West Indians by In Labor Force | Age 25-29
In terms of in labor force | age 25-29, the demographic groups most similar to West Indians are Immigrants from Fiji (83.6%, a difference of 0.040%), Puget Sound Salish (83.5%, a difference of 0.060%), Cuban (83.5%, a difference of 0.060%), Aleut (83.4%, a difference of 0.10%), and Immigrants from Bahamas (83.6%, a difference of 0.11%).
| Demographics | Rating | Rank | In Labor Force | Age 25-29 |
| Immigrants | Haiti | 0.2 /100 | #256 | Tragic 83.7% |
| Delaware | 0.2 /100 | #257 | Tragic 83.7% |
| Immigrants | Guatemala | 0.1 /100 | #258 | Tragic 83.6% |
| Spanish | 0.1 /100 | #259 | Tragic 83.6% |
| Immigrants | Bahamas | 0.1 /100 | #260 | Tragic 83.6% |
| Pennsylvania Germans | 0.1 /100 | #261 | Tragic 83.6% |
| Immigrants | Fiji | 0.1 /100 | #262 | Tragic 83.6% |
| West Indians | 0.1 /100 | #263 | Tragic 83.5% |
| Puget Sound Salish | 0.1 /100 | #264 | Tragic 83.5% |
| Cubans | 0.1 /100 | #265 | Tragic 83.5% |
| Aleuts | 0.0 /100 | #266 | Tragic 83.4% |
| Spanish Americans | 0.0 /100 | #267 | Tragic 83.4% |
| Immigrants | Lebanon | 0.0 /100 | #268 | Tragic 83.4% |
| Immigrants | Barbados | 0.0 /100 | #269 | Tragic 83.4% |
| Basques | 0.0 /100 | #270 | Tragic 83.4% |