Choctaw vs Sudanese In Labor Force | Age 30-34
COMPARE
Choctaw
Sudanese
In Labor Force | Age 30-34
In Labor Force | Age 30-34 Comparison
Choctaw
Sudanese
81.4%
IN LABOR FORCE | AGE 30-34
0.0/ 100
METRIC RATING
318th/ 347
METRIC RANK
85.2%
IN LABOR FORCE | AGE 30-34
97.1/ 100
METRIC RATING
100th/ 347
METRIC RANK
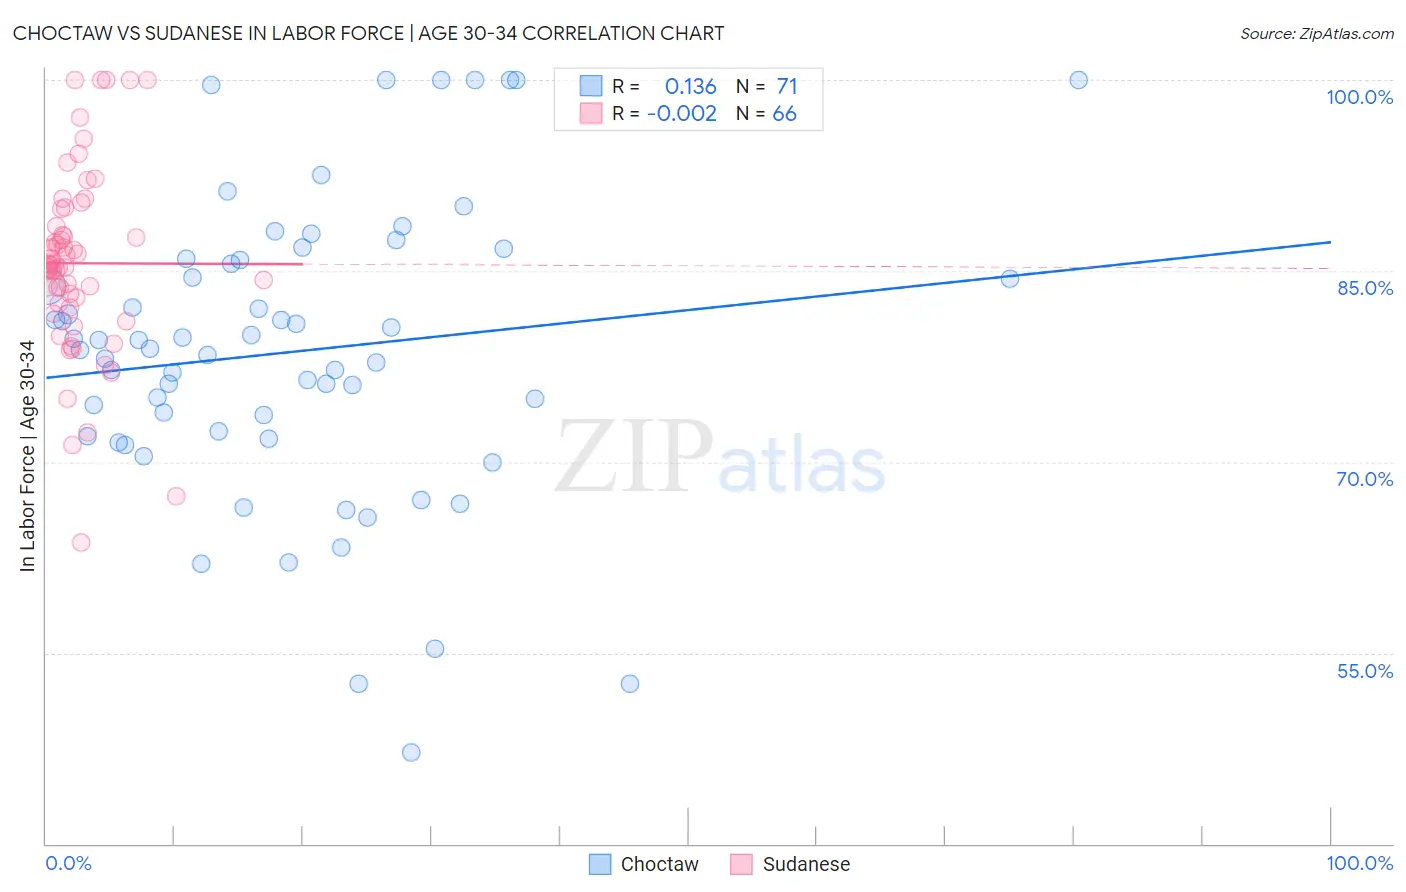
Choctaw vs Sudanese In Labor Force | Age 30-34 Correlation Chart
The statistical analysis conducted on geographies consisting of 269,615,470 people shows a poor positive correlation between the proportion of Choctaw and labor force participation rate among population between the ages 30 and 34 in the United States with a correlation coefficient (R) of 0.136 and weighted average of 81.4%. Similarly, the statistical analysis conducted on geographies consisting of 110,111,574 people shows no correlation between the proportion of Sudanese and labor force participation rate among population between the ages 30 and 34 in the United States with a correlation coefficient (R) of -0.002 and weighted average of 85.2%, a difference of 4.6%.
In Labor Force | Age 30-34 Correlation Summary
| Measurement | Choctaw | Sudanese |
| Minimum | 47.2% | 63.7% |
| Maximum | 100.0% | 100.0% |
| Range | 52.8% | 36.3% |
| Mean | 78.7% | 85.6% |
| Median | 78.9% | 85.4% |
| Interquartile 25% (IQ1) | 72.0% | 82.4% |
| Interquartile 75% (IQ3) | 85.9% | 88.5% |
| Interquartile Range (IQR) | 13.9% | 6.1% |
| Standard Deviation (Sample) | 11.6% | 7.2% |
| Standard Deviation (Population) | 11.5% | 7.2% |
Similar Demographics by In Labor Force | Age 30-34
Demographics Similar to Choctaw by In Labor Force | Age 30-34
In terms of in labor force | age 30-34, the demographic groups most similar to Choctaw are Shoshone (81.4%, a difference of 0.0%), Yaqui (81.4%, a difference of 0.020%), Immigrants from the Azores (81.5%, a difference of 0.080%), Arapaho (81.5%, a difference of 0.080%), and Alaska Native (81.3%, a difference of 0.10%).
| Demographics | Rating | Rank | In Labor Force | Age 30-34 |
| Chickasaw | 0.0 /100 | #311 | Tragic 81.9% |
| Mexicans | 0.0 /100 | #312 | Tragic 81.9% |
| Iroquois | 0.0 /100 | #313 | Tragic 81.9% |
| Alaskan Athabascans | 0.0 /100 | #314 | Tragic 81.7% |
| Cherokee | 0.0 /100 | #315 | Tragic 81.6% |
| Immigrants | Azores | 0.0 /100 | #316 | Tragic 81.5% |
| Arapaho | 0.0 /100 | #317 | Tragic 81.5% |
| Choctaw | 0.0 /100 | #318 | Tragic 81.4% |
| Shoshone | 0.0 /100 | #319 | Tragic 81.4% |
| Yaqui | 0.0 /100 | #320 | Tragic 81.4% |
| Alaska Natives | 0.0 /100 | #321 | Tragic 81.3% |
| Puerto Ricans | 0.0 /100 | #322 | Tragic 81.2% |
| Paiute | 0.0 /100 | #323 | Tragic 81.2% |
| Cheyenne | 0.0 /100 | #324 | Tragic 81.1% |
| Dutch West Indians | 0.0 /100 | #325 | Tragic 81.0% |
Demographics Similar to Sudanese by In Labor Force | Age 30-34
In terms of in labor force | age 30-34, the demographic groups most similar to Sudanese are Belgian (85.2%, a difference of 0.0%), Immigrants from Korea (85.2%, a difference of 0.010%), Thai (85.2%, a difference of 0.010%), Immigrants from Uganda (85.2%, a difference of 0.010%), and Immigrants from Belarus (85.2%, a difference of 0.010%).
| Demographics | Rating | Rank | In Labor Force | Age 30-34 |
| Immigrants | Norway | 97.6 /100 | #93 | Exceptional 85.2% |
| Swedes | 97.5 /100 | #94 | Exceptional 85.2% |
| Immigrants | India | 97.4 /100 | #95 | Exceptional 85.2% |
| Immigrants | Korea | 97.3 /100 | #96 | Exceptional 85.2% |
| Thais | 97.2 /100 | #97 | Exceptional 85.2% |
| Immigrants | Uganda | 97.2 /100 | #98 | Exceptional 85.2% |
| Belgians | 97.2 /100 | #99 | Exceptional 85.2% |
| Sudanese | 97.1 /100 | #100 | Exceptional 85.2% |
| Immigrants | Belarus | 96.9 /100 | #101 | Exceptional 85.2% |
| Immigrants | Austria | 96.8 /100 | #102 | Exceptional 85.2% |
| Ukrainians | 96.6 /100 | #103 | Exceptional 85.2% |
| Immigrants | Ghana | 96.5 /100 | #104 | Exceptional 85.2% |
| Alsatians | 96.3 /100 | #105 | Exceptional 85.2% |
| Immigrants | Middle Africa | 96.3 /100 | #106 | Exceptional 85.2% |
| Immigrants | Northern Africa | 96.3 /100 | #107 | Exceptional 85.2% |