Choctaw vs Potawatomi In Labor Force | Age 30-34
COMPARE
Choctaw
Potawatomi
In Labor Force | Age 30-34
In Labor Force | Age 30-34 Comparison
Choctaw
Potawatomi
81.4%
IN LABOR FORCE | AGE 30-34
0.0/ 100
METRIC RATING
318th/ 347
METRIC RANK
82.8%
IN LABOR FORCE | AGE 30-34
0.0/ 100
METRIC RATING
291st/ 347
METRIC RANK
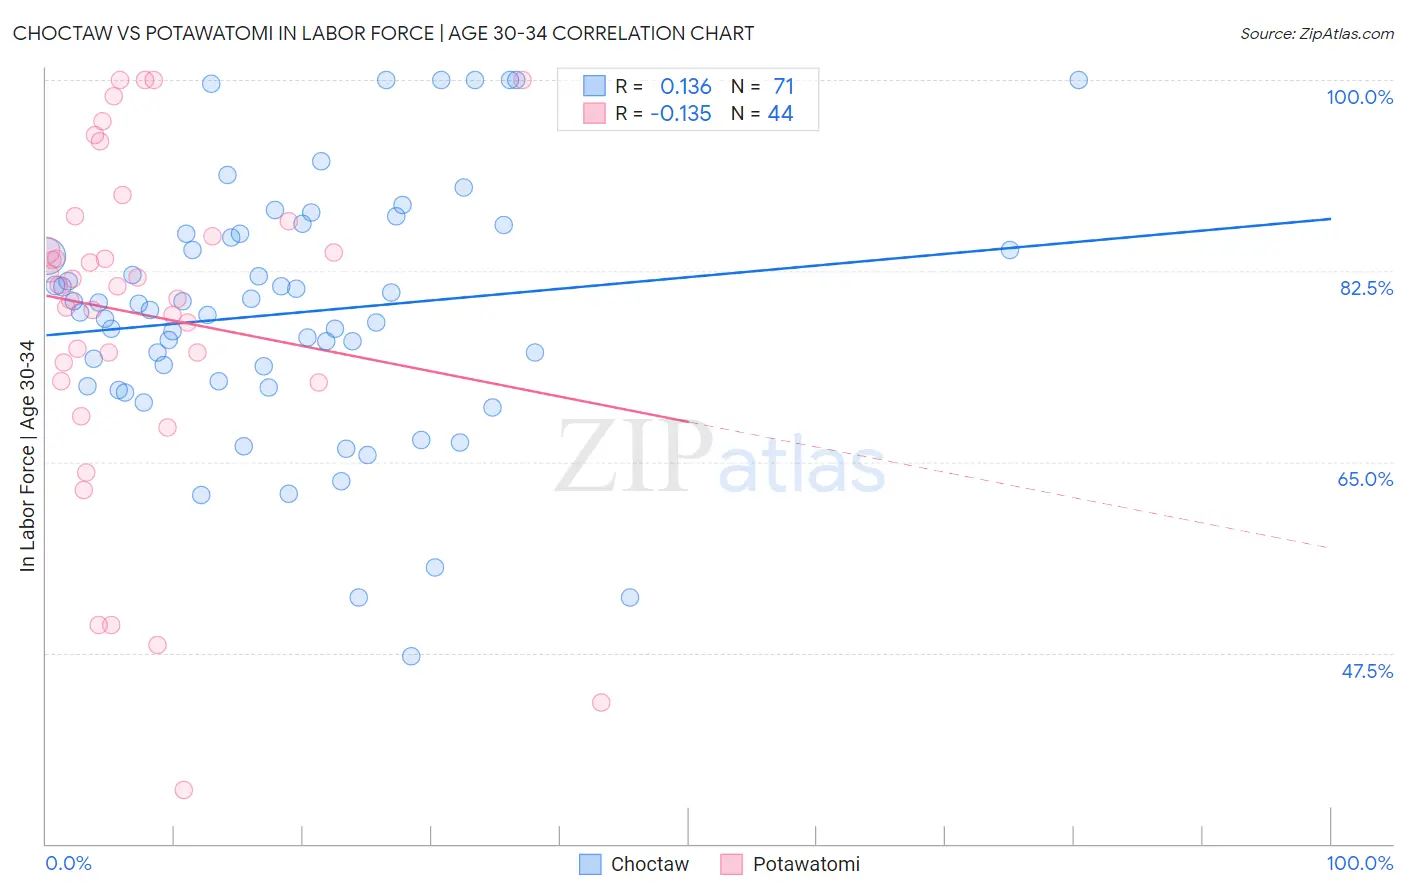
Choctaw vs Potawatomi In Labor Force | Age 30-34 Correlation Chart
The statistical analysis conducted on geographies consisting of 269,615,470 people shows a poor positive correlation between the proportion of Choctaw and labor force participation rate among population between the ages 30 and 34 in the United States with a correlation coefficient (R) of 0.136 and weighted average of 81.4%. Similarly, the statistical analysis conducted on geographies consisting of 117,760,740 people shows a poor negative correlation between the proportion of Potawatomi and labor force participation rate among population between the ages 30 and 34 in the United States with a correlation coefficient (R) of -0.135 and weighted average of 82.8%, a difference of 1.7%.
In Labor Force | Age 30-34 Correlation Summary
| Measurement | Choctaw | Potawatomi |
| Minimum | 47.2% | 34.9% |
| Maximum | 100.0% | 100.0% |
| Range | 52.8% | 65.1% |
| Mean | 78.7% | 78.5% |
| Median | 78.9% | 81.2% |
| Interquartile 25% (IQ1) | 72.0% | 73.3% |
| Interquartile 75% (IQ3) | 85.9% | 86.4% |
| Interquartile Range (IQR) | 13.9% | 13.1% |
| Standard Deviation (Sample) | 11.6% | 15.3% |
| Standard Deviation (Population) | 11.5% | 15.2% |
Similar Demographics by In Labor Force | Age 30-34
Demographics Similar to Choctaw by In Labor Force | Age 30-34
In terms of in labor force | age 30-34, the demographic groups most similar to Choctaw are Shoshone (81.4%, a difference of 0.0%), Yaqui (81.4%, a difference of 0.020%), Immigrants from the Azores (81.5%, a difference of 0.080%), Arapaho (81.5%, a difference of 0.080%), and Alaska Native (81.3%, a difference of 0.10%).
| Demographics | Rating | Rank | In Labor Force | Age 30-34 |
| Chickasaw | 0.0 /100 | #311 | Tragic 81.9% |
| Mexicans | 0.0 /100 | #312 | Tragic 81.9% |
| Iroquois | 0.0 /100 | #313 | Tragic 81.9% |
| Alaskan Athabascans | 0.0 /100 | #314 | Tragic 81.7% |
| Cherokee | 0.0 /100 | #315 | Tragic 81.6% |
| Immigrants | Azores | 0.0 /100 | #316 | Tragic 81.5% |
| Arapaho | 0.0 /100 | #317 | Tragic 81.5% |
| Choctaw | 0.0 /100 | #318 | Tragic 81.4% |
| Shoshone | 0.0 /100 | #319 | Tragic 81.4% |
| Yaqui | 0.0 /100 | #320 | Tragic 81.4% |
| Alaska Natives | 0.0 /100 | #321 | Tragic 81.3% |
| Puerto Ricans | 0.0 /100 | #322 | Tragic 81.2% |
| Paiute | 0.0 /100 | #323 | Tragic 81.2% |
| Cheyenne | 0.0 /100 | #324 | Tragic 81.1% |
| Dutch West Indians | 0.0 /100 | #325 | Tragic 81.0% |
Demographics Similar to Potawatomi by In Labor Force | Age 30-34
In terms of in labor force | age 30-34, the demographic groups most similar to Potawatomi are Blackfeet (82.8%, a difference of 0.020%), Black/African American (82.8%, a difference of 0.020%), Nepalese (82.7%, a difference of 0.080%), American (82.7%, a difference of 0.11%), and Pennsylvania German (82.6%, a difference of 0.23%).
| Demographics | Rating | Rank | In Labor Force | Age 30-34 |
| Immigrants | Belize | 0.0 /100 | #284 | Tragic 83.2% |
| Cree | 0.0 /100 | #285 | Tragic 83.2% |
| Immigrants | Latin America | 0.0 /100 | #286 | Tragic 83.1% |
| Native Hawaiians | 0.0 /100 | #287 | Tragic 83.0% |
| Central American Indians | 0.0 /100 | #288 | Tragic 83.0% |
| Hawaiians | 0.0 /100 | #289 | Tragic 83.0% |
| Blackfeet | 0.0 /100 | #290 | Tragic 82.8% |
| Potawatomi | 0.0 /100 | #291 | Tragic 82.8% |
| Blacks/African Americans | 0.0 /100 | #292 | Tragic 82.8% |
| Nepalese | 0.0 /100 | #293 | Tragic 82.7% |
| Americans | 0.0 /100 | #294 | Tragic 82.7% |
| Pennsylvania Germans | 0.0 /100 | #295 | Tragic 82.6% |
| Chippewa | 0.0 /100 | #296 | Tragic 82.6% |
| Comanche | 0.0 /100 | #297 | Tragic 82.6% |
| Aleuts | 0.0 /100 | #298 | Tragic 82.6% |