Choctaw vs Immigrants from Germany Professional Degree

COMPARE

Choctaw
Race
Ancestry
AfghanAfricanAlaska NativeAlaskan AthabascanAlbanianAleutAlsatianAmericanApacheArabArapahoArgentineanArmenianAssyrian/Chaldean/SyriacAustralianAustrianBahamianBangladeshiBarbadianBasqueBelgianBelizeanBermudanBhutaneseBlackfeetBolivianBrazilianBritishBritish West IndianBulgarianBurmeseCajunCambodianCanadianCape VerdeanCarpatho RusynCelticCentral AmericanCentral American IndianCherokeeCheyenneChickasawChileanChineseChippewaChoctawColombianColvilleComancheCosta RicanCreeCreekCroatianCrowCubanCypriotCzechCzechoslovakianDanishDelawareDominicanDutchDutch West IndianEastern EuropeanEcuadorianEgyptianEnglishEstonianEthiopianEuropeanFijianFilipinoFinnishFrenchFrench American IndianFrench CanadianGermanGerman RussianGhanaianGreekGuamanian/ChamorroGuatemalanGuyaneseHaitianHmongHonduranHopiHoumaHungarianIcelanderIndian (Asian)IndonesianInupiatIranianIraqiIrishIroquoisIsraeliItalianJamaicanJapaneseJordanianKenyanKiowaKoreanLaotianLatvianLebaneseLiberianLithuanianLumbeeLuxembourgerMacedonianMalaysianMalteseMarshalleseMenomineeMexicanMexican American IndianMongolianMoroccanNative HawaiianNavajoNepaleseNew ZealanderNicaraguanNigerianNorthern EuropeanNorwegianOkinawanOsageOttawaPaiutePakistaniPalestinianPanamanianParaguayanPennsylvania GermanPeruvianPimaPolishPortuguesePotawatomiPuebloPuerto RicanPuget Sound SalishRomanianRussianSalvadoranSamoanScandinavianScotch-IrishScottishSeminoleSenegaleseSerbianShoshoneSierra LeoneanSiouxSlavicSlovakSloveneSomaliSouth AfricanSouth AmericanSouth American IndianSoviet UnionSpaniardSpanishSpanish AmericanSpanish American IndianSri LankanSubsaharan AfricanSudaneseSwedishSwissSyrianTaiwaneseThaiTlingit-HaidaTohono O'OdhamTonganTrinidadian and TobagonianTsimshianTurkishU.S. Virgin IslanderUgandanUkrainianUruguayanUteVenezuelanVietnameseWelshWest IndianYakamaYaquiYugoslavianYumanYup'ikZimbabwean
Immigration
NonimmigrantsImmigrantsAfghanistanAfricaAlbaniaArgentinaArmeniaAsiaAustraliaAustriaBahamasBangladeshBarbadosBelarusBelgiumBelizeBoliviaBosnia and HerzegovinaBrazilBulgariaBurma/MyanmarCabo VerdeCambodiaCameroonCanadaCaribbeanCentral AmericaChileChinaColombiaCongoCosta RicaCroatiaCubaCzechoslovakiaDenmarkDominicaDominican RepublicEastern AfricaEastern AsiaEastern EuropeEcuadorEgyptEl SalvadorEnglandEritreaEthiopiaEuropeFijiFranceGhanaGreeceGrenadaGuatemalaGuyanaHaitiHondurasHong KongHungaryIndiaIndonesiaIranIraqIrelandIsraelItalyJamaicaJapanJordanKazakhstanKenyaKoreaKuwaitLaosLatin AmericaLatviaLebanonLiberiaLithuaniaMalaysiaMexicoMicronesiaMiddle AfricaMoldovaMoroccoNepalNetherlandsNicaraguaNigeriaNorth AmericaNorth MacedoniaNorthern AfricaNorthern EuropeNorwayOceaniaPakistanPanamaPeruPhilippinesPolandPortugalRomaniaRussiaSaudi ArabiaScotlandSenegalSerbiaSierra LeoneSingaporeSomaliaSouth AfricaSouth AmericaSouth Central AsiaSouth Eastern AsiaSouthern EuropeSpainSri LankaSt. Vincent and the GrenadinesSudanSwedenSwitzerlandSyriaTaiwanThailandTrinidad and TobagoTurkeyUgandaUkraineUruguayUzbekistanVenezuelaVietnamWest IndiesWestern AfricaWestern AsiaWestern EuropeYemenZaireZimbabweAzores
Immigrants from Germany
Race
Ancestry
AfghanAfricanAlaska NativeAlaskan AthabascanAlbanianAleutAlsatianAmericanApacheArabArapahoArgentineanArmenianAssyrian/Chaldean/SyriacAustralianAustrianBahamianBangladeshiBarbadianBasqueBelgianBelizeanBermudanBhutaneseBlackfeetBolivianBrazilianBritishBritish West IndianBulgarianBurmeseCajunCambodianCanadianCape VerdeanCarpatho RusynCelticCentral AmericanCentral American IndianCherokeeCheyenneChickasawChileanChineseChippewaColombianColvilleComancheCosta RicanCreeCreekCroatianCrowCubanCypriotCzechCzechoslovakianDanishDelawareDominicanDutchDutch West IndianEastern EuropeanEcuadorianEgyptianEnglishEstonianEthiopianEuropeanFijianFilipinoFinnishFrenchFrench American IndianFrench CanadianGermanGerman RussianGhanaianGreekGuamanian/ChamorroGuatemalanGuyaneseHaitianHmongHonduranHopiHoumaHungarianIcelanderIndian (Asian)IndonesianInupiatIranianIraqiIrishIroquoisIsraeliItalianJamaicanJapaneseJordanianKenyanKiowaKoreanLaotianLatvianLebaneseLiberianLithuanianLumbeeLuxembourgerMacedonianMalaysianMalteseMarshalleseMenomineeMexicanMexican American IndianMongolianMoroccanNative HawaiianNavajoNepaleseNew ZealanderNicaraguanNigerianNorthern EuropeanNorwegianOkinawanOsageOttawaPaiutePakistaniPalestinianPanamanianParaguayanPennsylvania GermanPeruvianPimaPolishPortuguesePotawatomiPuebloPuerto RicanPuget Sound SalishRomanianRussianSalvadoranSamoanScandinavianScotch-IrishScottishSeminoleSenegaleseSerbianShoshoneSierra LeoneanSiouxSlavicSlovakSloveneSomaliSouth AfricanSouth AmericanSouth American IndianSoviet UnionSpaniardSpanishSpanish AmericanSpanish American IndianSri LankanSubsaharan AfricanSudaneseSwedishSwissSyrianTaiwaneseThaiTlingit-HaidaTohono O'OdhamTonganTrinidadian and TobagonianTsimshianTurkishU.S. Virgin IslanderUgandanUkrainianUruguayanUteVenezuelanVietnameseWelshWest IndianYakamaYaquiYugoslavianYumanYup'ikZimbabwean
Immigration
NonimmigrantsImmigrantsAfghanistanAfricaAlbaniaArgentinaArmeniaAsiaAustraliaAustriaBahamasBangladeshBarbadosBelarusBelgiumBelizeBoliviaBosnia and HerzegovinaBrazilBulgariaBurma/MyanmarCabo VerdeCambodiaCameroonCanadaCaribbeanCentral AmericaChileChinaColombiaCongoCosta RicaCroatiaCubaCzechoslovakiaDenmarkDominicaDominican RepublicEastern AfricaEastern AsiaEastern EuropeEcuadorEgyptEl SalvadorEnglandEritreaEthiopiaEuropeFijiFranceGermanyGhanaGreeceGrenadaGuatemalaGuyanaHaitiHondurasHong KongHungaryIndiaIndonesiaIranIraqIrelandIsraelItalyJamaicaJapanJordanKazakhstanKenyaKoreaKuwaitLaosLatin AmericaLatviaLebanonLiberiaLithuaniaMalaysiaMexicoMicronesiaMiddle AfricaMoldovaMoroccoNepalNetherlandsNicaraguaNigeriaNorth AmericaNorth MacedoniaNorthern AfricaNorthern EuropeNorwayOceaniaPakistanPanamaPeruPhilippinesPolandPortugalRomaniaRussiaSaudi ArabiaScotlandSenegalSerbiaSierra LeoneSingaporeSomaliaSouth AfricaSouth AmericaSouth Central AsiaSouth Eastern AsiaSouthern EuropeSpainSri LankaSt. Vincent and the GrenadinesSudanSwedenSwitzerlandSyriaTaiwanThailandTrinidad and TobagoTurkeyUgandaUkraineUruguayUzbekistanVenezuelaVietnamWest IndiesWestern AfricaWestern AsiaWestern EuropeYemenZaireZimbabweAzores
Professional Degree
Income
Poverty
Unemployment
Labor Participation
Family Structure
Vehicle Availability
Education Level
Disability

Professional Degree Comparison

Choctaw

Immigrants from Germany

Tragic
Exceptional
3.2%
PROFESSIONAL DEGREE
0.1/ 100
METRIC RATING
319th/ 347
METRIC RANK
4.9%
PROFESSIONAL DEGREE
94.1/ 100
METRIC RATING
122nd/ 347
METRIC RANK

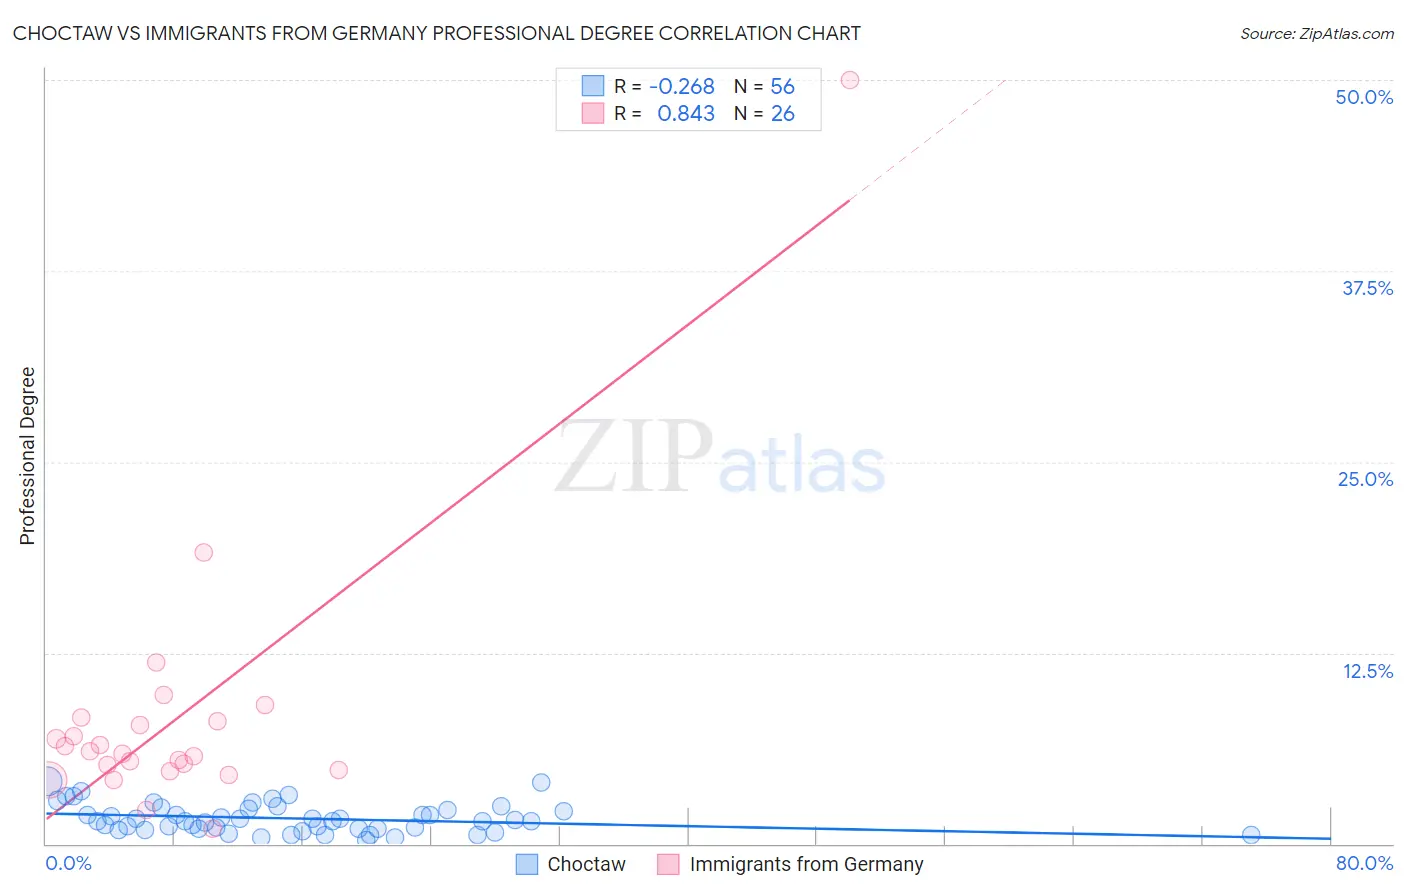
Choctaw vs Immigrants from Germany Professional Degree Correlation Chart

The statistical analysis conducted on geographies consisting of 268,673,582 people shows a weak negative correlation between the proportion of Choctaw and percentage of population with at least professional degree education in the United States with a correlation coefficient (R) of -0.268 and weighted average of 3.2%. Similarly, the statistical analysis conducted on geographies consisting of 462,387,748 people shows a very strong positive correlation between the proportion of Immigrants from Germany and percentage of population with at least professional degree education in the United States with a correlation coefficient (R) of 0.843 and weighted average of 4.9%, a difference of 50.2%.
Choctaw vs Immigrants from Germany Professional Degree

Professional Degree Correlation Summary

MeasurementChoctawImmigrants from Germany
Minimum0.25%0.95%
Maximum4.1%50.0%
Range3.9%49.0%
Mean1.7%8.3%
Median1.5%6.0%
Interquartile 25% (IQ1)0.97%4.8%
Interquartile 75% (IQ3)2.3%8.0%
Interquartile Range (IQR)1.3%3.2%
Standard Deviation (Sample)0.93%9.2%
Standard Deviation (Population)0.92%9.0%

Similar Demographics by Professional Degree

Demographics Similar to Choctaw by Professional Degree

In terms of professional degree, the demographic groups most similar to Choctaw are Immigrants from Micronesia (3.2%, a difference of 0.24%), Nepalese (3.2%, a difference of 0.27%), Puerto Rican (3.2%, a difference of 0.48%), Immigrants from Laos (3.2%, a difference of 0.50%), and Seminole (3.2%, a difference of 1.1%).
DemographicsRating | RankProfessional Degree
Sioux
0.1
/100
|
#312
Tragic
3.3%
Yuman
0.1
/100
|
#313
Tragic
3.3%
Mexican American Indians
0.1
/100
|
#314
Tragic
3.3%
Immigrants | Laos
0.1
/100
|
#315
Tragic
3.2%
Puerto Ricans
0.1
/100
|
#316
Tragic
3.2%
Nepalese
0.1
/100
|
#317
Tragic
3.2%
Immigrants | Micronesia
0.1
/100
|
#318
Tragic
3.2%
Choctaw
0.1
/100
|
#319
Tragic
3.2%
Seminole
0.1
/100
|
#320
Tragic
3.2%
Tsimshian
0.0
/100
|
#321
Tragic
3.2%
Hispanics or Latinos
0.0
/100
|
#322
Tragic
3.2%
Inupiat
0.0
/100
|
#323
Tragic
3.2%
Crow
0.0
/100
|
#324
Tragic
3.2%
Yaqui
0.0
/100
|
#325
Tragic
3.2%
Menominee
0.0
/100
|
#326
Tragic
3.1%

Demographics Similar to Immigrants from Germany by Professional Degree

In terms of professional degree, the demographic groups most similar to Immigrants from Germany are Immigrants from Venezuela (4.8%, a difference of 0.17%), Immigrants from Eritrea (4.8%, a difference of 0.35%), Immigrants from Moldova (4.9%, a difference of 0.46%), Immigrants from Albania (4.8%, a difference of 0.47%), and European (4.8%, a difference of 0.52%).
DemographicsRating | RankProfessional Degree
Moroccans
96.8
/100
|
#115
Exceptional
5.0%
Venezuelans
96.3
/100
|
#116
Exceptional
4.9%
Immigrants | Syria
96.0
/100
|
#117
Exceptional
4.9%
Croatians
96.0
/100
|
#118
Exceptional
4.9%
Immigrants | Sudan
95.4
/100
|
#119
Exceptional
4.9%
Albanians
95.3
/100
|
#120
Exceptional
4.9%
Immigrants | Moldova
94.8
/100
|
#121
Exceptional
4.9%
Immigrants | Germany
94.1
/100
|
#122
Exceptional
4.9%
Immigrants | Venezuela
93.8
/100
|
#123
Exceptional
4.8%
Immigrants | Eritrea
93.5
/100
|
#124
Exceptional
4.8%
Immigrants | Albania
93.3
/100
|
#125
Exceptional
4.8%
Europeans
93.2
/100
|
#126
Exceptional
4.8%
Serbians
92.6
/100
|
#127
Exceptional
4.8%
Immigrants | Eastern Africa
92.5
/100
|
#128
Exceptional
4.8%
Palestinians
91.5
/100
|
#129
Exceptional
4.8%