Choctaw vs Guamanian/Chamorro Cognitive Disability
COMPARE
Choctaw
Guamanian/Chamorro
Cognitive Disability
Cognitive Disability Comparison
Choctaw
Guamanians/Chamorros
18.4%
COGNITIVE DISABILITY
0.0/ 100
METRIC RATING
310th/ 347
METRIC RANK
17.9%
COGNITIVE DISABILITY
0.5/ 100
METRIC RATING
261st/ 347
METRIC RANK
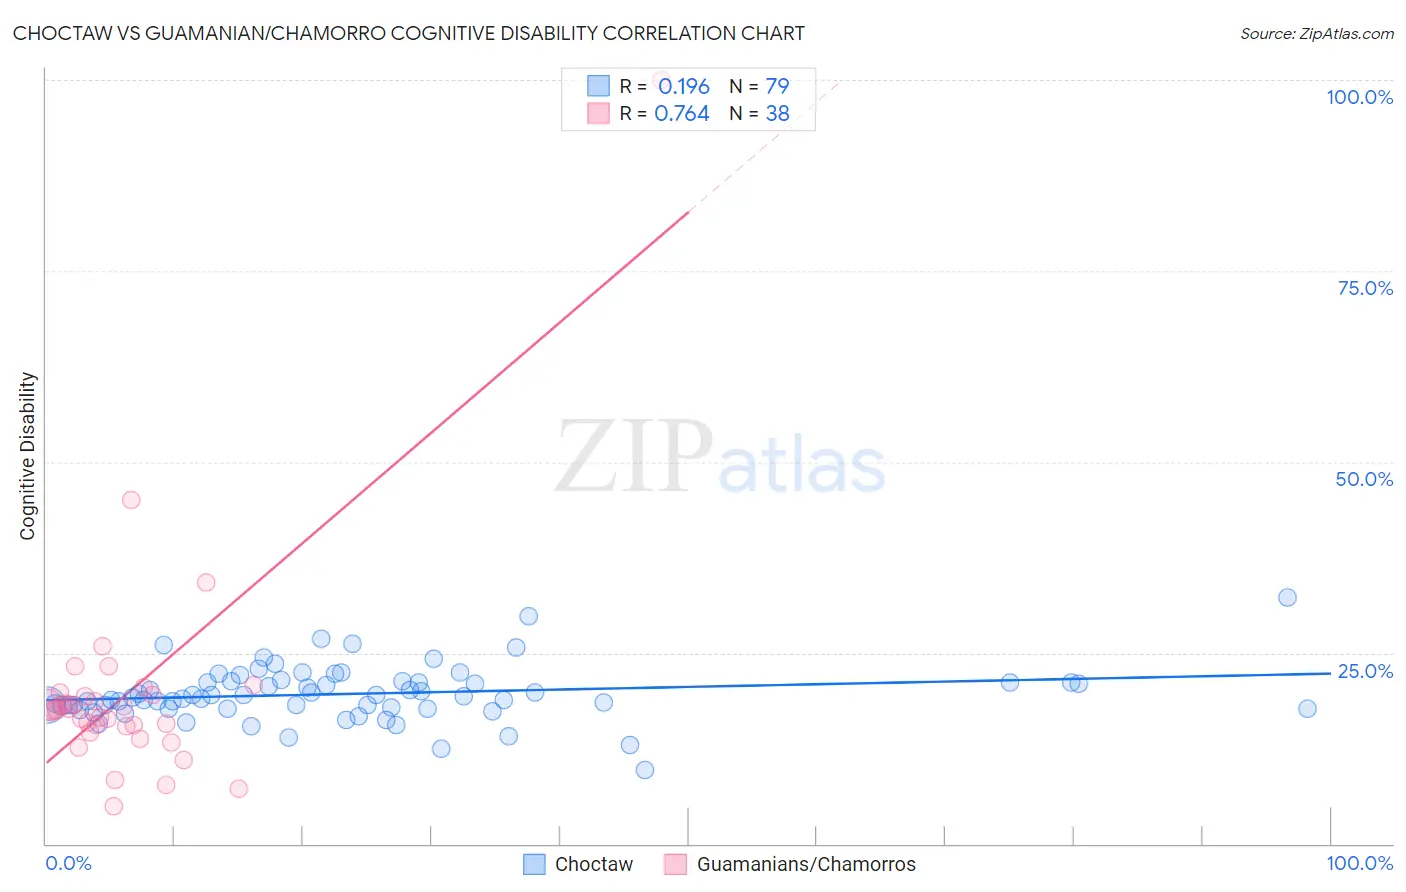
Choctaw vs Guamanian/Chamorro Cognitive Disability Correlation Chart
The statistical analysis conducted on geographies consisting of 269,665,834 people shows a poor positive correlation between the proportion of Choctaw and percentage of population with cognitive disability in the United States with a correlation coefficient (R) of 0.196 and weighted average of 18.4%. Similarly, the statistical analysis conducted on geographies consisting of 221,888,944 people shows a strong positive correlation between the proportion of Guamanians/Chamorros and percentage of population with cognitive disability in the United States with a correlation coefficient (R) of 0.764 and weighted average of 17.9%, a difference of 2.8%.
Cognitive Disability Correlation Summary
| Measurement | Choctaw | Guamanian/Chamorro |
| Minimum | 9.7% | 5.0% |
| Maximum | 32.3% | 100.0% |
| Range | 22.6% | 95.0% |
| Mean | 19.6% | 19.8% |
| Median | 19.1% | 17.5% |
| Interquartile 25% (IQ1) | 17.8% | 15.4% |
| Interquartile 75% (IQ3) | 21.1% | 19.5% |
| Interquartile Range (IQR) | 3.4% | 4.0% |
| Standard Deviation (Sample) | 3.6% | 15.1% |
| Standard Deviation (Population) | 3.5% | 14.9% |
Similar Demographics by Cognitive Disability
Demographics Similar to Choctaw by Cognitive Disability
In terms of cognitive disability, the demographic groups most similar to Choctaw are Hmong (18.4%, a difference of 0.030%), Chickasaw (18.5%, a difference of 0.31%), Immigrants from Eastern Africa (18.4%, a difference of 0.37%), Immigrants from Western Africa (18.4%, a difference of 0.41%), and Yaqui (18.5%, a difference of 0.42%).
| Demographics | Rating | Rank | Cognitive Disability |
| Immigrants | Kenya | 0.0 /100 | #303 | Tragic 18.3% |
| Immigrants | Eritrea | 0.0 /100 | #304 | Tragic 18.3% |
| Colville | 0.0 /100 | #305 | Tragic 18.3% |
| Seminole | 0.0 /100 | #306 | Tragic 18.3% |
| Ugandans | 0.0 /100 | #307 | Tragic 18.3% |
| Immigrants | Western Africa | 0.0 /100 | #308 | Tragic 18.4% |
| Immigrants | Eastern Africa | 0.0 /100 | #309 | Tragic 18.4% |
| Choctaw | 0.0 /100 | #310 | Tragic 18.4% |
| Hmong | 0.0 /100 | #311 | Tragic 18.4% |
| Chickasaw | 0.0 /100 | #312 | Tragic 18.5% |
| Yaqui | 0.0 /100 | #313 | Tragic 18.5% |
| Sub-Saharan Africans | 0.0 /100 | #314 | Tragic 18.5% |
| Immigrants | Dominica | 0.0 /100 | #315 | Tragic 18.6% |
| Immigrants | Middle Africa | 0.0 /100 | #316 | Tragic 18.6% |
| Liberians | 0.0 /100 | #317 | Tragic 18.6% |
Demographics Similar to Guamanians/Chamorros by Cognitive Disability
In terms of cognitive disability, the demographic groups most similar to Guamanians/Chamorros are Sierra Leonean (17.9%, a difference of 0.030%), Immigrants from Belize (17.9%, a difference of 0.050%), Ethiopian (17.9%, a difference of 0.060%), Immigrants from Barbados (17.9%, a difference of 0.070%), and Menominee (18.0%, a difference of 0.13%).
| Demographics | Rating | Rank | Cognitive Disability |
| Hispanics or Latinos | 0.6 /100 | #254 | Tragic 17.9% |
| Immigrants | Azores | 0.6 /100 | #255 | Tragic 17.9% |
| Bahamians | 0.6 /100 | #256 | Tragic 17.9% |
| Mexican American Indians | 0.6 /100 | #257 | Tragic 17.9% |
| Immigrants | Armenia | 0.6 /100 | #258 | Tragic 17.9% |
| Ethiopians | 0.5 /100 | #259 | Tragic 17.9% |
| Immigrants | Belize | 0.5 /100 | #260 | Tragic 17.9% |
| Guamanians/Chamorros | 0.5 /100 | #261 | Tragic 17.9% |
| Sierra Leoneans | 0.4 /100 | #262 | Tragic 17.9% |
| Immigrants | Barbados | 0.4 /100 | #263 | Tragic 17.9% |
| Menominee | 0.4 /100 | #264 | Tragic 18.0% |
| Spanish Americans | 0.4 /100 | #265 | Tragic 18.0% |
| Belizeans | 0.4 /100 | #266 | Tragic 18.0% |
| Nepalese | 0.3 /100 | #267 | Tragic 18.0% |
| Cherokee | 0.3 /100 | #268 | Tragic 18.0% |