Chippewa vs British In Labor Force | Age 20-24
COMPARE
Chippewa
British
In Labor Force | Age 20-24
In Labor Force | Age 20-24 Comparison
Chippewa
British
77.1%
IN LABOR FORCE | AGE 20-24
99.9/ 100
METRIC RATING
57th/ 347
METRIC RANK
76.7%
IN LABOR FORCE | AGE 20-24
99.8/ 100
METRIC RATING
73rd/ 347
METRIC RANK
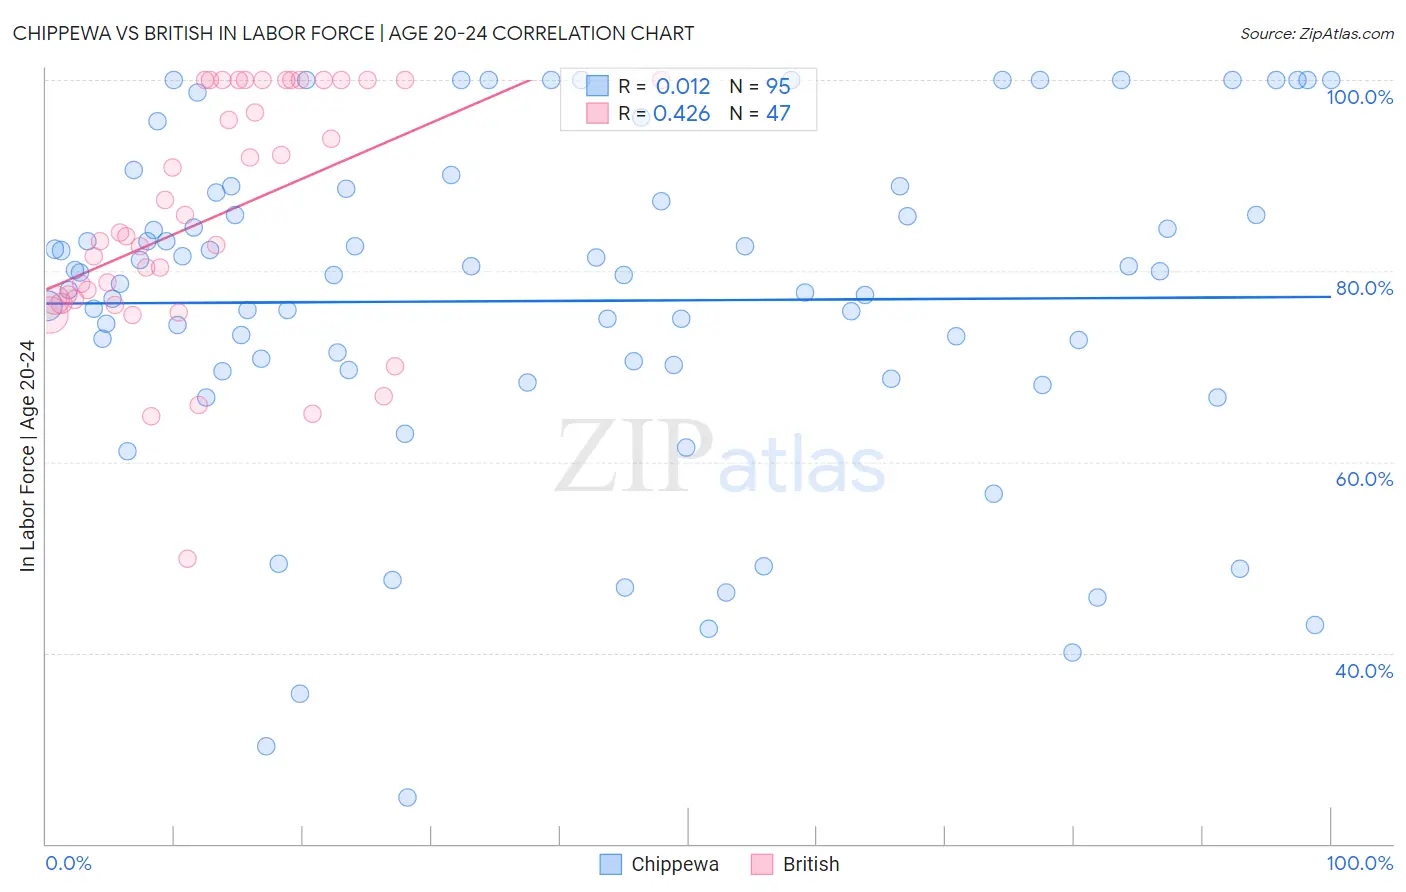
Chippewa vs British In Labor Force | Age 20-24 Correlation Chart
The statistical analysis conducted on geographies consisting of 214,944,357 people shows no correlation between the proportion of Chippewa and labor force participation rate among population between the ages 20 and 24 in the United States with a correlation coefficient (R) of 0.012 and weighted average of 77.1%. Similarly, the statistical analysis conducted on geographies consisting of 530,798,308 people shows a moderate positive correlation between the proportion of British and labor force participation rate among population between the ages 20 and 24 in the United States with a correlation coefficient (R) of 0.426 and weighted average of 76.7%, a difference of 0.47%.
In Labor Force | Age 20-24 Correlation Summary
| Measurement | Chippewa | British |
| Minimum | 24.8% | 49.8% |
| Maximum | 100.0% | 100.0% |
| Range | 75.2% | 50.2% |
| Mean | 76.9% | 85.6% |
| Median | 79.6% | 83.6% |
| Interquartile 25% (IQ1) | 69.6% | 77.0% |
| Interquartile 75% (IQ3) | 88.2% | 100.0% |
| Interquartile Range (IQR) | 18.6% | 23.0% |
| Standard Deviation (Sample) | 17.6% | 12.7% |
| Standard Deviation (Population) | 17.5% | 12.5% |
Demographics Similar to Chippewa and British by In Labor Force | Age 20-24
In terms of in labor force | age 20-24, the demographic groups most similar to Chippewa are Immigrants from Liberia (77.1%, a difference of 0.020%), European (77.1%, a difference of 0.020%), Hawaiian (77.0%, a difference of 0.020%), Scotch-Irish (77.0%, a difference of 0.050%), and Kenyan (77.0%, a difference of 0.080%). Similarly, the demographic groups most similar to British are Guamanian/Chamorro (76.7%, a difference of 0.050%), Cree (76.6%, a difference of 0.070%), Northern European (76.8%, a difference of 0.080%), Immigrants from Middle Africa (76.6%, a difference of 0.090%), and Ottawa (76.8%, a difference of 0.15%).
| Demographics | Rating | Rank | In Labor Force | Age 20-24 |
| Immigrants | Liberia | 99.9 /100 | #55 | Exceptional 77.1% |
| Europeans | 99.9 /100 | #56 | Exceptional 77.1% |
| Chippewa | 99.9 /100 | #57 | Exceptional 77.1% |
| Hawaiians | 99.9 /100 | #58 | Exceptional 77.0% |
| Scotch-Irish | 99.9 /100 | #59 | Exceptional 77.0% |
| Kenyans | 99.9 /100 | #60 | Exceptional 77.0% |
| Immigrants | Eritrea | 99.9 /100 | #61 | Exceptional 77.0% |
| Immigrants | Kenya | 99.9 /100 | #62 | Exceptional 77.0% |
| Lithuanians | 99.9 /100 | #63 | Exceptional 77.0% |
| Whites/Caucasians | 99.9 /100 | #64 | Exceptional 76.9% |
| Crow | 99.9 /100 | #65 | Exceptional 76.9% |
| Icelanders | 99.9 /100 | #66 | Exceptional 76.9% |
| Slavs | 99.9 /100 | #67 | Exceptional 76.9% |
| French American Indians | 99.8 /100 | #68 | Exceptional 76.8% |
| Immigrants | Sudan | 99.8 /100 | #69 | Exceptional 76.8% |
| Ottawa | 99.8 /100 | #70 | Exceptional 76.8% |
| Northern Europeans | 99.8 /100 | #71 | Exceptional 76.8% |
| Guamanians/Chamorros | 99.8 /100 | #72 | Exceptional 76.7% |
| British | 99.8 /100 | #73 | Exceptional 76.7% |
| Cree | 99.7 /100 | #74 | Exceptional 76.6% |
| Immigrants | Middle Africa | 99.7 /100 | #75 | Exceptional 76.6% |