Chippewa vs Belizean In Labor Force | Age 20-24
COMPARE
Chippewa
Belizean
In Labor Force | Age 20-24
In Labor Force | Age 20-24 Comparison
Chippewa
Belizeans
77.1%
IN LABOR FORCE | AGE 20-24
99.9/ 100
METRIC RATING
57th/ 347
METRIC RANK
73.4%
IN LABOR FORCE | AGE 20-24
0.3/ 100
METRIC RATING
272nd/ 347
METRIC RANK
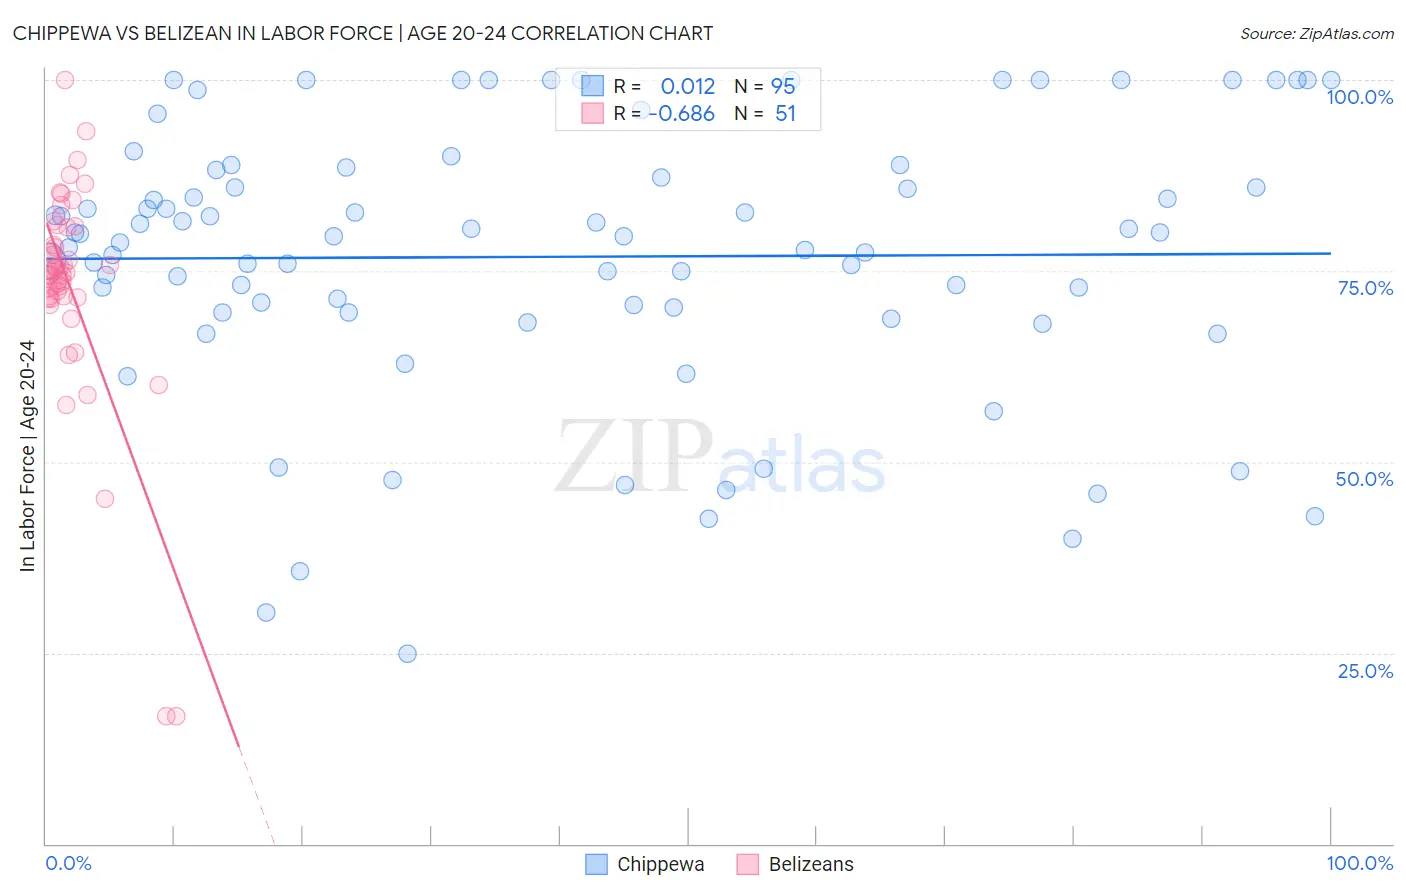
Chippewa vs Belizean In Labor Force | Age 20-24 Correlation Chart
The statistical analysis conducted on geographies consisting of 214,944,357 people shows no correlation between the proportion of Chippewa and labor force participation rate among population between the ages 20 and 24 in the United States with a correlation coefficient (R) of 0.012 and weighted average of 77.1%. Similarly, the statistical analysis conducted on geographies consisting of 144,207,582 people shows a significant negative correlation between the proportion of Belizeans and labor force participation rate among population between the ages 20 and 24 in the United States with a correlation coefficient (R) of -0.686 and weighted average of 73.4%, a difference of 5.0%.
In Labor Force | Age 20-24 Correlation Summary
| Measurement | Chippewa | Belizean |
| Minimum | 24.8% | 16.7% |
| Maximum | 100.0% | 100.0% |
| Range | 75.2% | 83.3% |
| Mean | 76.9% | 73.0% |
| Median | 79.6% | 74.6% |
| Interquartile 25% (IQ1) | 69.6% | 71.5% |
| Interquartile 75% (IQ3) | 88.2% | 80.8% |
| Interquartile Range (IQR) | 18.6% | 9.3% |
| Standard Deviation (Sample) | 17.6% | 14.6% |
| Standard Deviation (Population) | 17.5% | 14.5% |
Similar Demographics by In Labor Force | Age 20-24
Demographics Similar to Chippewa by In Labor Force | Age 20-24
In terms of in labor force | age 20-24, the demographic groups most similar to Chippewa are Immigrants from Liberia (77.1%, a difference of 0.020%), European (77.1%, a difference of 0.020%), Hawaiian (77.0%, a difference of 0.020%), Celtic (77.1%, a difference of 0.040%), and Scotch-Irish (77.0%, a difference of 0.050%).
| Demographics | Rating | Rank | In Labor Force | Age 20-24 |
| Malaysians | 100.0 /100 | #50 | Exceptional 77.2% |
| Croatians | 100.0 /100 | #51 | Exceptional 77.2% |
| Indonesians | 100.0 /100 | #52 | Exceptional 77.2% |
| Immigrants | Azores | 100.0 /100 | #53 | Exceptional 77.2% |
| Celtics | 99.9 /100 | #54 | Exceptional 77.1% |
| Immigrants | Liberia | 99.9 /100 | #55 | Exceptional 77.1% |
| Europeans | 99.9 /100 | #56 | Exceptional 77.1% |
| Chippewa | 99.9 /100 | #57 | Exceptional 77.1% |
| Hawaiians | 99.9 /100 | #58 | Exceptional 77.0% |
| Scotch-Irish | 99.9 /100 | #59 | Exceptional 77.0% |
| Kenyans | 99.9 /100 | #60 | Exceptional 77.0% |
| Immigrants | Eritrea | 99.9 /100 | #61 | Exceptional 77.0% |
| Immigrants | Kenya | 99.9 /100 | #62 | Exceptional 77.0% |
| Lithuanians | 99.9 /100 | #63 | Exceptional 77.0% |
| Whites/Caucasians | 99.9 /100 | #64 | Exceptional 76.9% |
Demographics Similar to Belizeans by In Labor Force | Age 20-24
In terms of in labor force | age 20-24, the demographic groups most similar to Belizeans are Immigrants from Indonesia (73.4%, a difference of 0.010%), Cheyenne (73.4%, a difference of 0.030%), Immigrants from Colombia (73.4%, a difference of 0.050%), Immigrants from Russia (73.5%, a difference of 0.060%), and Colombian (73.5%, a difference of 0.10%).
| Demographics | Rating | Rank | In Labor Force | Age 20-24 |
| Burmese | 0.5 /100 | #265 | Tragic 73.6% |
| Haitians | 0.5 /100 | #266 | Tragic 73.6% |
| Immigrants | Western Asia | 0.4 /100 | #267 | Tragic 73.5% |
| South Americans | 0.4 /100 | #268 | Tragic 73.5% |
| Colombians | 0.3 /100 | #269 | Tragic 73.5% |
| Immigrants | Russia | 0.3 /100 | #270 | Tragic 73.5% |
| Immigrants | Indonesia | 0.3 /100 | #271 | Tragic 73.4% |
| Belizeans | 0.3 /100 | #272 | Tragic 73.4% |
| Cheyenne | 0.2 /100 | #273 | Tragic 73.4% |
| Immigrants | Colombia | 0.2 /100 | #274 | Tragic 73.4% |
| Immigrants | South America | 0.2 /100 | #275 | Tragic 73.3% |
| Mongolians | 0.2 /100 | #276 | Tragic 73.3% |
| Immigrants | Malaysia | 0.2 /100 | #277 | Tragic 73.3% |
| Cypriots | 0.2 /100 | #278 | Tragic 73.3% |
| Venezuelans | 0.2 /100 | #279 | Tragic 73.3% |