Chinese vs Estonian In Labor Force | Age 30-34
COMPARE
Chinese
Estonian
In Labor Force | Age 30-34
In Labor Force | Age 30-34 Comparison
Chinese
Estonians
85.0%
IN LABOR FORCE | AGE 30-34
89.6/ 100
METRIC RATING
131st/ 347
METRIC RANK
85.9%
IN LABOR FORCE | AGE 30-34
100.0/ 100
METRIC RATING
23rd/ 347
METRIC RANK
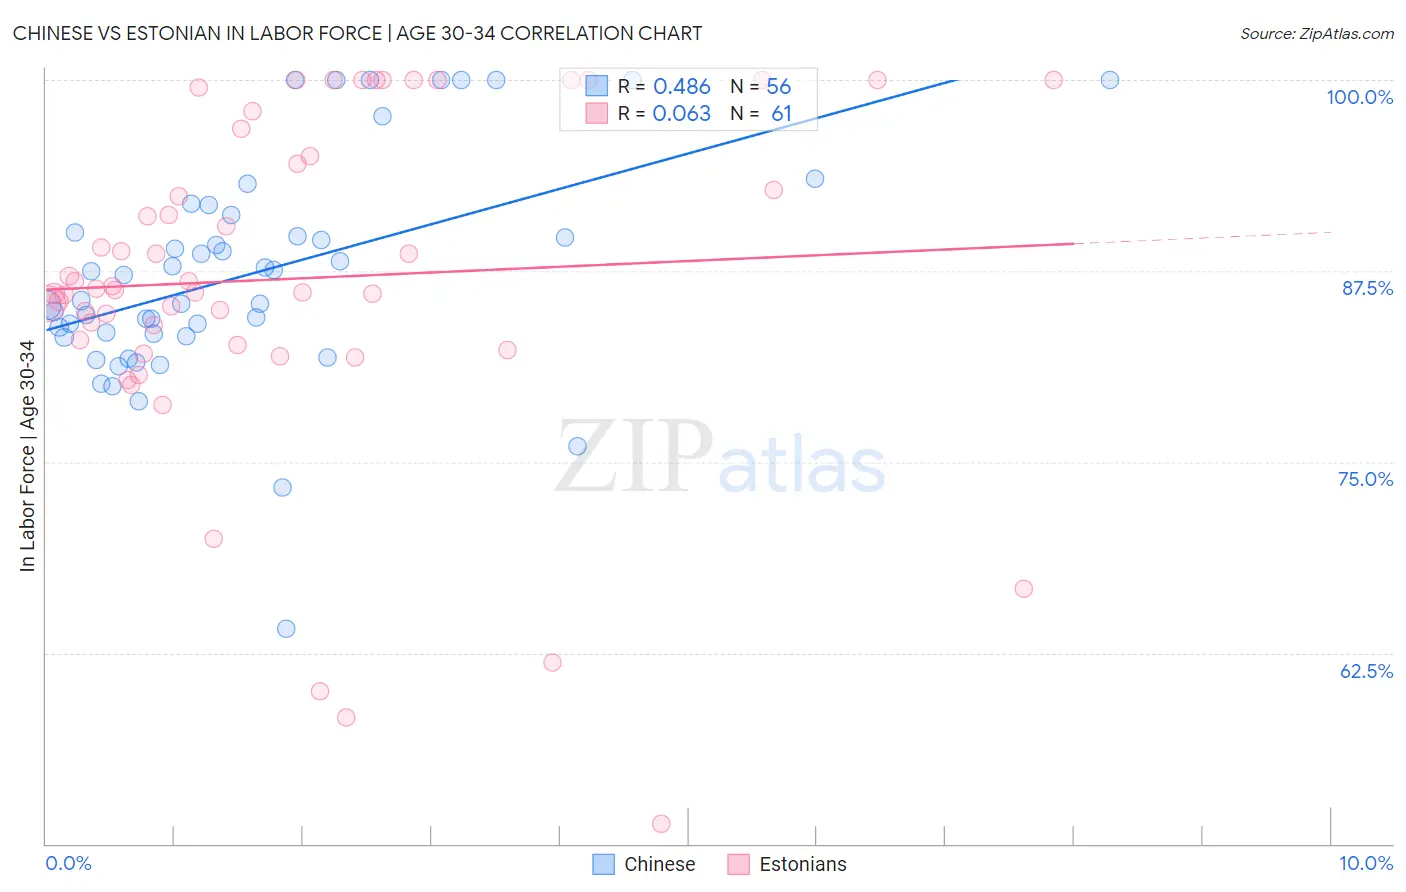
Chinese vs Estonian In Labor Force | Age 30-34 Correlation Chart
The statistical analysis conducted on geographies consisting of 64,801,795 people shows a moderate positive correlation between the proportion of Chinese and labor force participation rate among population between the ages 30 and 34 in the United States with a correlation coefficient (R) of 0.486 and weighted average of 85.0%. Similarly, the statistical analysis conducted on geographies consisting of 123,489,392 people shows a slight positive correlation between the proportion of Estonians and labor force participation rate among population between the ages 30 and 34 in the United States with a correlation coefficient (R) of 0.063 and weighted average of 85.9%, a difference of 1.1%.
In Labor Force | Age 30-34 Correlation Summary
| Measurement | Chinese | Estonian |
| Minimum | 64.1% | 51.3% |
| Maximum | 100.0% | 100.0% |
| Range | 35.9% | 48.7% |
| Mean | 87.3% | 87.0% |
| Median | 86.4% | 86.3% |
| Interquartile 25% (IQ1) | 83.3% | 82.8% |
| Interquartile 75% (IQ3) | 90.6% | 95.9% |
| Interquartile Range (IQR) | 7.3% | 13.1% |
| Standard Deviation (Sample) | 7.3% | 10.9% |
| Standard Deviation (Population) | 7.3% | 10.9% |
Similar Demographics by In Labor Force | Age 30-34
Demographics Similar to Chinese by In Labor Force | Age 30-34
In terms of in labor force | age 30-34, the demographic groups most similar to Chinese are Immigrants from Israel (85.0%, a difference of 0.0%), New Zealander (85.0%, a difference of 0.0%), Immigrants from Western Africa (85.0%, a difference of 0.010%), Immigrants from Spain (85.0%, a difference of 0.010%), and Immigrants from Chile (85.0%, a difference of 0.010%).
| Demographics | Rating | Rank | In Labor Force | Age 30-34 |
| Australians | 92.0 /100 | #124 | Exceptional 85.0% |
| Immigrants | Jordan | 91.5 /100 | #125 | Exceptional 85.0% |
| Austrians | 90.9 /100 | #126 | Exceptional 85.0% |
| Slavs | 90.7 /100 | #127 | Exceptional 85.0% |
| Immigrants | Argentina | 90.6 /100 | #128 | Exceptional 85.0% |
| Immigrants | Western Africa | 90.2 /100 | #129 | Exceptional 85.0% |
| Immigrants | Spain | 90.0 /100 | #130 | Exceptional 85.0% |
| Chinese | 89.6 /100 | #131 | Excellent 85.0% |
| Immigrants | Israel | 89.5 /100 | #132 | Excellent 85.0% |
| New Zealanders | 89.5 /100 | #133 | Excellent 85.0% |
| Immigrants | Chile | 89.2 /100 | #134 | Excellent 85.0% |
| Immigrants | Asia | 88.9 /100 | #135 | Excellent 85.0% |
| Jordanians | 88.6 /100 | #136 | Excellent 85.0% |
| South Africans | 88.0 /100 | #137 | Excellent 85.0% |
| Sri Lankans | 87.8 /100 | #138 | Excellent 85.0% |
Demographics Similar to Estonians by In Labor Force | Age 30-34
In terms of in labor force | age 30-34, the demographic groups most similar to Estonians are Bermudan (85.9%, a difference of 0.0%), Immigrants from Eritrea (85.9%, a difference of 0.010%), Immigrants from North Macedonia (85.9%, a difference of 0.020%), Sierra Leonean (86.0%, a difference of 0.030%), and Bulgarian (86.0%, a difference of 0.030%).
| Demographics | Rating | Rank | In Labor Force | Age 30-34 |
| Latvians | 100.0 /100 | #16 | Exceptional 86.0% |
| Immigrants | Cameroon | 100.0 /100 | #17 | Exceptional 86.0% |
| Immigrants | Sierra Leone | 100.0 /100 | #18 | Exceptional 86.0% |
| Sierra Leoneans | 100.0 /100 | #19 | Exceptional 86.0% |
| Bulgarians | 100.0 /100 | #20 | Exceptional 86.0% |
| Immigrants | Bulgaria | 100.0 /100 | #21 | Exceptional 86.0% |
| Bermudans | 100.0 /100 | #22 | Exceptional 85.9% |
| Estonians | 100.0 /100 | #23 | Exceptional 85.9% |
| Immigrants | Eritrea | 100.0 /100 | #24 | Exceptional 85.9% |
| Immigrants | North Macedonia | 100.0 /100 | #25 | Exceptional 85.9% |
| Immigrants | Eastern Africa | 100.0 /100 | #26 | Exceptional 85.9% |
| Immigrants | Liberia | 100.0 /100 | #27 | Exceptional 85.9% |
| Immigrants | Latvia | 100.0 /100 | #28 | Exceptional 85.9% |
| Tsimshian | 100.0 /100 | #29 | Exceptional 85.8% |
| Immigrants | Hong Kong | 100.0 /100 | #30 | Exceptional 85.8% |