Chinese vs Icelander In Labor Force | Age 30-34
COMPARE
Chinese
Icelander
In Labor Force | Age 30-34
In Labor Force | Age 30-34 Comparison
Chinese
Icelanders
85.0%
IN LABOR FORCE | AGE 30-34
89.6/ 100
METRIC RATING
131st/ 347
METRIC RANK
84.7%
IN LABOR FORCE | AGE 30-34
56.8/ 100
METRIC RATING
164th/ 347
METRIC RANK
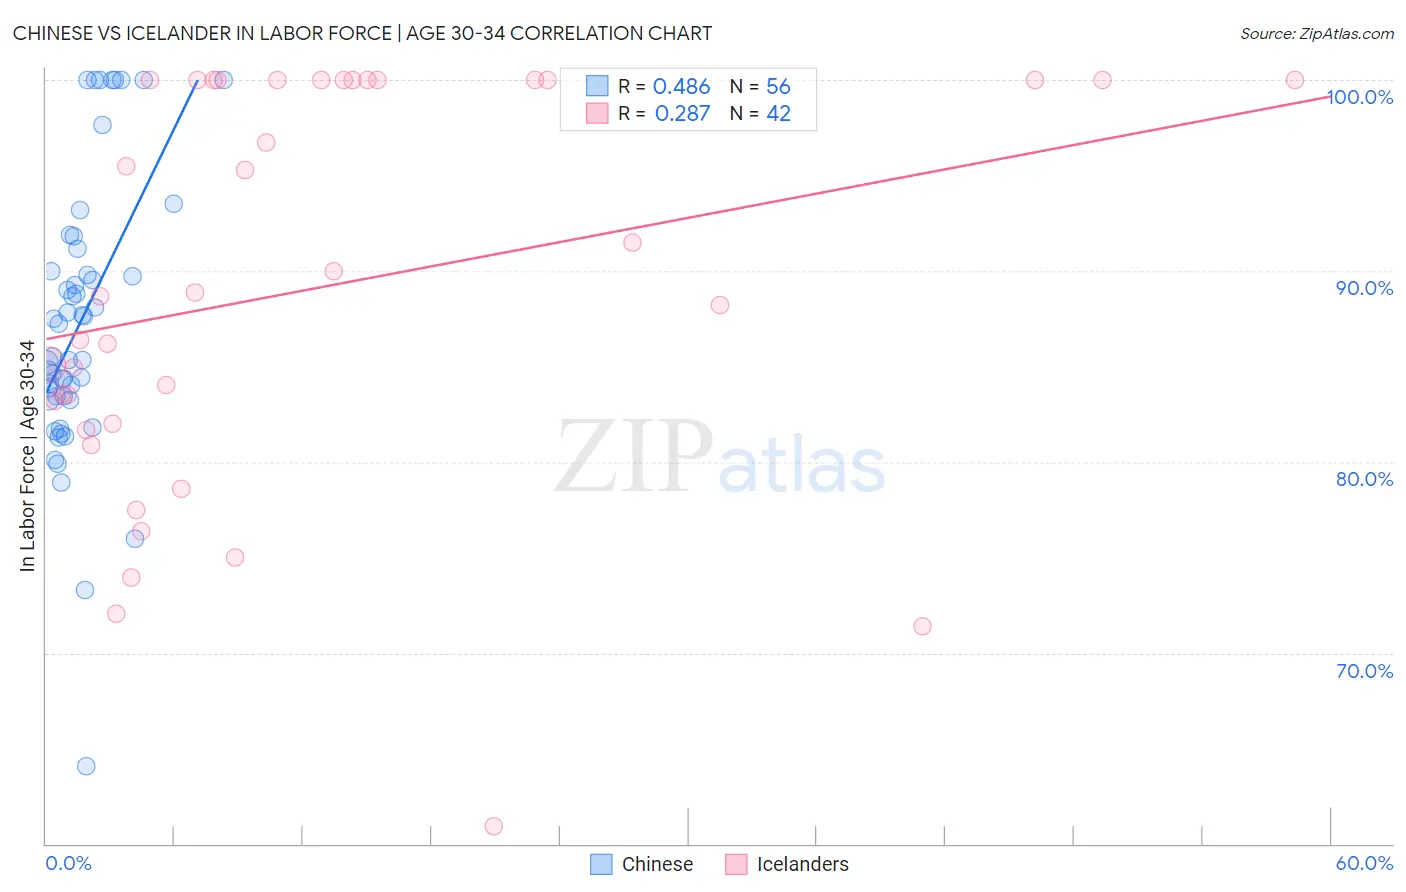
Chinese vs Icelander In Labor Force | Age 30-34 Correlation Chart
The statistical analysis conducted on geographies consisting of 64,801,795 people shows a moderate positive correlation between the proportion of Chinese and labor force participation rate among population between the ages 30 and 34 in the United States with a correlation coefficient (R) of 0.486 and weighted average of 85.0%. Similarly, the statistical analysis conducted on geographies consisting of 159,636,707 people shows a weak positive correlation between the proportion of Icelanders and labor force participation rate among population between the ages 30 and 34 in the United States with a correlation coefficient (R) of 0.287 and weighted average of 84.7%, a difference of 0.33%.
In Labor Force | Age 30-34 Correlation Summary
| Measurement | Chinese | Icelander |
| Minimum | 64.1% | 60.9% |
| Maximum | 100.0% | 100.0% |
| Range | 35.9% | 39.1% |
| Mean | 87.3% | 89.1% |
| Median | 86.4% | 88.8% |
| Interquartile 25% (IQ1) | 83.3% | 82.0% |
| Interquartile 75% (IQ3) | 90.6% | 100.0% |
| Interquartile Range (IQR) | 7.3% | 18.0% |
| Standard Deviation (Sample) | 7.3% | 10.5% |
| Standard Deviation (Population) | 7.3% | 10.4% |
Similar Demographics by In Labor Force | Age 30-34
Demographics Similar to Chinese by In Labor Force | Age 30-34
In terms of in labor force | age 30-34, the demographic groups most similar to Chinese are Immigrants from Israel (85.0%, a difference of 0.0%), New Zealander (85.0%, a difference of 0.0%), Immigrants from Western Africa (85.0%, a difference of 0.010%), Immigrants from Spain (85.0%, a difference of 0.010%), and Immigrants from Chile (85.0%, a difference of 0.010%).
| Demographics | Rating | Rank | In Labor Force | Age 30-34 |
| Australians | 92.0 /100 | #124 | Exceptional 85.0% |
| Immigrants | Jordan | 91.5 /100 | #125 | Exceptional 85.0% |
| Austrians | 90.9 /100 | #126 | Exceptional 85.0% |
| Slavs | 90.7 /100 | #127 | Exceptional 85.0% |
| Immigrants | Argentina | 90.6 /100 | #128 | Exceptional 85.0% |
| Immigrants | Western Africa | 90.2 /100 | #129 | Exceptional 85.0% |
| Immigrants | Spain | 90.0 /100 | #130 | Exceptional 85.0% |
| Chinese | 89.6 /100 | #131 | Excellent 85.0% |
| Immigrants | Israel | 89.5 /100 | #132 | Excellent 85.0% |
| New Zealanders | 89.5 /100 | #133 | Excellent 85.0% |
| Immigrants | Chile | 89.2 /100 | #134 | Excellent 85.0% |
| Immigrants | Asia | 88.9 /100 | #135 | Excellent 85.0% |
| Jordanians | 88.6 /100 | #136 | Excellent 85.0% |
| South Africans | 88.0 /100 | #137 | Excellent 85.0% |
| Sri Lankans | 87.8 /100 | #138 | Excellent 85.0% |
Demographics Similar to Icelanders by In Labor Force | Age 30-34
In terms of in labor force | age 30-34, the demographic groups most similar to Icelanders are Immigrants from Uruguay (84.7%, a difference of 0.0%), Immigrants from Western Europe (84.7%, a difference of 0.0%), South American (84.7%, a difference of 0.010%), Afghan (84.7%, a difference of 0.010%), and Immigrants from South Eastern Asia (84.7%, a difference of 0.020%).
| Demographics | Rating | Rank | In Labor Force | Age 30-34 |
| Peruvians | 65.9 /100 | #157 | Good 84.8% |
| Immigrants | Armenia | 64.7 /100 | #158 | Good 84.8% |
| Czechoslovakians | 63.0 /100 | #159 | Good 84.8% |
| Pakistanis | 60.8 /100 | #160 | Good 84.7% |
| Immigrants | Cambodia | 60.7 /100 | #161 | Good 84.7% |
| South Americans | 58.7 /100 | #162 | Average 84.7% |
| Immigrants | Uruguay | 57.4 /100 | #163 | Average 84.7% |
| Icelanders | 56.8 /100 | #164 | Average 84.7% |
| Immigrants | Western Europe | 56.7 /100 | #165 | Average 84.7% |
| Afghans | 55.2 /100 | #166 | Average 84.7% |
| Immigrants | South Eastern Asia | 54.2 /100 | #167 | Average 84.7% |
| Immigrants | Peru | 52.4 /100 | #168 | Average 84.7% |
| South American Indians | 52.1 /100 | #169 | Average 84.7% |
| Immigrants | Burma/Myanmar | 52.0 /100 | #170 | Average 84.7% |
| Irish | 52.0 /100 | #171 | Average 84.7% |