Cape Verdean vs Estonian In Labor Force | Age 30-34
COMPARE
Cape Verdean
Estonian
In Labor Force | Age 30-34
In Labor Force | Age 30-34 Comparison
Cape Verdeans
Estonians
85.6%
IN LABOR FORCE | AGE 30-34
99.7/ 100
METRIC RATING
51st/ 347
METRIC RANK
85.9%
IN LABOR FORCE | AGE 30-34
100.0/ 100
METRIC RATING
23rd/ 347
METRIC RANK
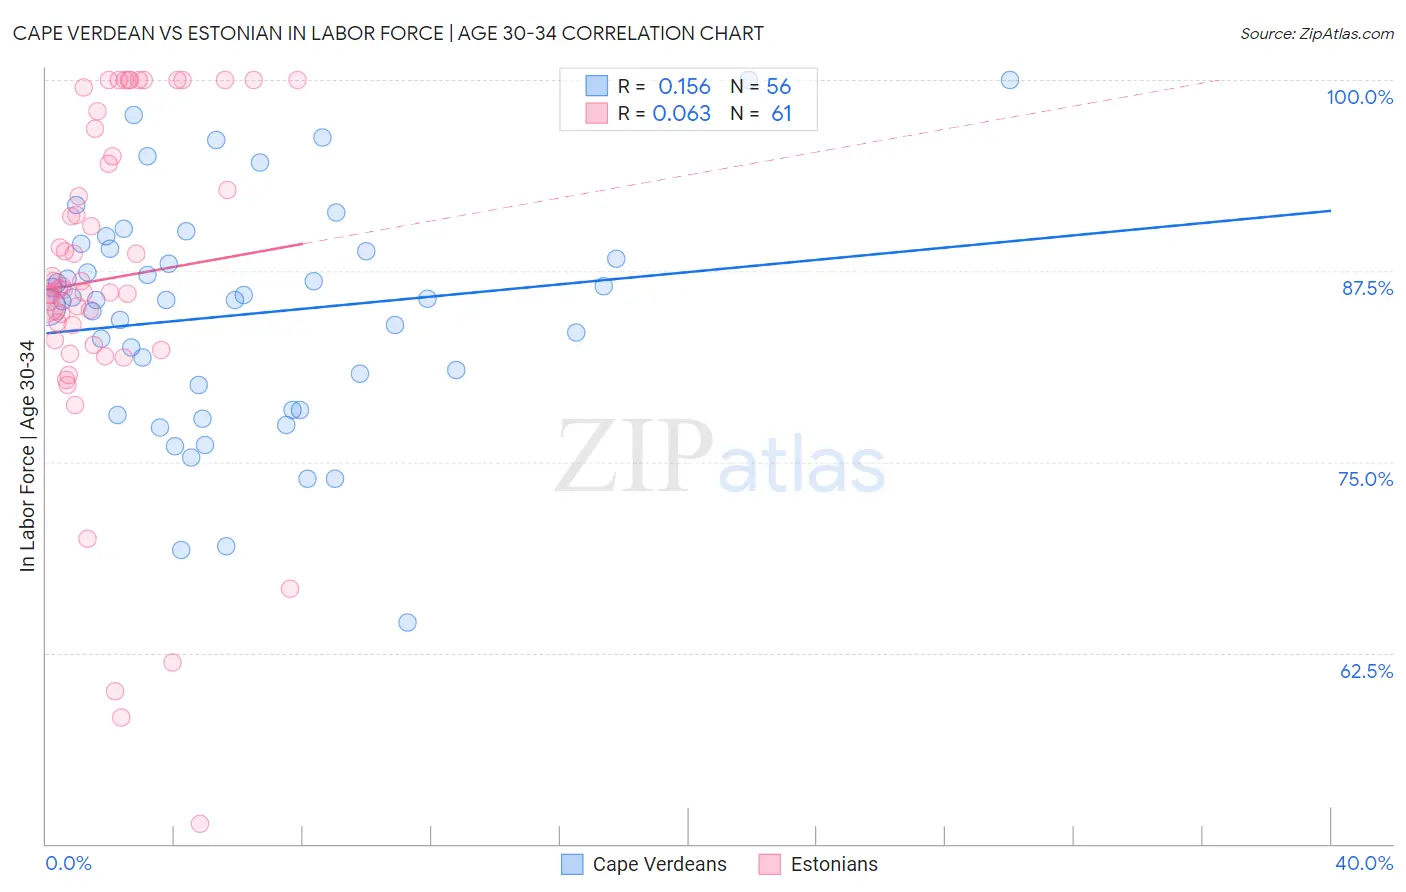
Cape Verdean vs Estonian In Labor Force | Age 30-34 Correlation Chart
The statistical analysis conducted on geographies consisting of 107,546,273 people shows a poor positive correlation between the proportion of Cape Verdeans and labor force participation rate among population between the ages 30 and 34 in the United States with a correlation coefficient (R) of 0.156 and weighted average of 85.6%. Similarly, the statistical analysis conducted on geographies consisting of 123,489,392 people shows a slight positive correlation between the proportion of Estonians and labor force participation rate among population between the ages 30 and 34 in the United States with a correlation coefficient (R) of 0.063 and weighted average of 85.9%, a difference of 0.44%.
In Labor Force | Age 30-34 Correlation Summary
| Measurement | Cape Verdean | Estonian |
| Minimum | 64.5% | 51.3% |
| Maximum | 100.0% | 100.0% |
| Range | 35.5% | 48.7% |
| Mean | 84.7% | 87.0% |
| Median | 85.6% | 86.3% |
| Interquartile 25% (IQ1) | 79.2% | 82.8% |
| Interquartile 75% (IQ3) | 88.9% | 95.9% |
| Interquartile Range (IQR) | 9.7% | 13.1% |
| Standard Deviation (Sample) | 7.5% | 10.9% |
| Standard Deviation (Population) | 7.4% | 10.9% |
Similar Demographics by In Labor Force | Age 30-34
Demographics Similar to Cape Verdeans by In Labor Force | Age 30-34
In terms of in labor force | age 30-34, the demographic groups most similar to Cape Verdeans are Slovene (85.6%, a difference of 0.010%), Immigrants from Australia (85.6%, a difference of 0.020%), Lithuanian (85.6%, a difference of 0.030%), Immigrants from Sweden (85.6%, a difference of 0.040%), and Immigrants from Morocco (85.6%, a difference of 0.050%).
| Demographics | Rating | Rank | In Labor Force | Age 30-34 |
| Immigrants | Sri Lanka | 99.8 /100 | #44 | Exceptional 85.6% |
| Immigrants | Nepal | 99.8 /100 | #45 | Exceptional 85.6% |
| Immigrants | Morocco | 99.8 /100 | #46 | Exceptional 85.6% |
| Croatians | 99.8 /100 | #47 | Exceptional 85.6% |
| Immigrants | Sweden | 99.8 /100 | #48 | Exceptional 85.6% |
| Lithuanians | 99.8 /100 | #49 | Exceptional 85.6% |
| Immigrants | Australia | 99.8 /100 | #50 | Exceptional 85.6% |
| Cape Verdeans | 99.7 /100 | #51 | Exceptional 85.6% |
| Slovenes | 99.7 /100 | #52 | Exceptional 85.6% |
| Filipinos | 99.6 /100 | #53 | Exceptional 85.5% |
| Immigrants | Kenya | 99.6 /100 | #54 | Exceptional 85.5% |
| Immigrants | Turkey | 99.6 /100 | #55 | Exceptional 85.5% |
| Czechs | 99.6 /100 | #56 | Exceptional 85.5% |
| Russians | 99.6 /100 | #57 | Exceptional 85.5% |
| Poles | 99.6 /100 | #58 | Exceptional 85.5% |
Demographics Similar to Estonians by In Labor Force | Age 30-34
In terms of in labor force | age 30-34, the demographic groups most similar to Estonians are Bermudan (85.9%, a difference of 0.0%), Immigrants from Eritrea (85.9%, a difference of 0.010%), Immigrants from North Macedonia (85.9%, a difference of 0.020%), Sierra Leonean (86.0%, a difference of 0.030%), and Bulgarian (86.0%, a difference of 0.030%).
| Demographics | Rating | Rank | In Labor Force | Age 30-34 |
| Latvians | 100.0 /100 | #16 | Exceptional 86.0% |
| Immigrants | Cameroon | 100.0 /100 | #17 | Exceptional 86.0% |
| Immigrants | Sierra Leone | 100.0 /100 | #18 | Exceptional 86.0% |
| Sierra Leoneans | 100.0 /100 | #19 | Exceptional 86.0% |
| Bulgarians | 100.0 /100 | #20 | Exceptional 86.0% |
| Immigrants | Bulgaria | 100.0 /100 | #21 | Exceptional 86.0% |
| Bermudans | 100.0 /100 | #22 | Exceptional 85.9% |
| Estonians | 100.0 /100 | #23 | Exceptional 85.9% |
| Immigrants | Eritrea | 100.0 /100 | #24 | Exceptional 85.9% |
| Immigrants | North Macedonia | 100.0 /100 | #25 | Exceptional 85.9% |
| Immigrants | Eastern Africa | 100.0 /100 | #26 | Exceptional 85.9% |
| Immigrants | Liberia | 100.0 /100 | #27 | Exceptional 85.9% |
| Immigrants | Latvia | 100.0 /100 | #28 | Exceptional 85.9% |
| Tsimshian | 100.0 /100 | #29 | Exceptional 85.8% |
| Immigrants | Hong Kong | 100.0 /100 | #30 | Exceptional 85.8% |