Chinese vs Arapaho In Labor Force | Age 30-34
COMPARE
Chinese
Arapaho
In Labor Force | Age 30-34
In Labor Force | Age 30-34 Comparison
Chinese
Arapaho
85.0%
IN LABOR FORCE | AGE 30-34
89.6/ 100
METRIC RATING
131st/ 347
METRIC RANK
81.5%
IN LABOR FORCE | AGE 30-34
0.0/ 100
METRIC RATING
317th/ 347
METRIC RANK
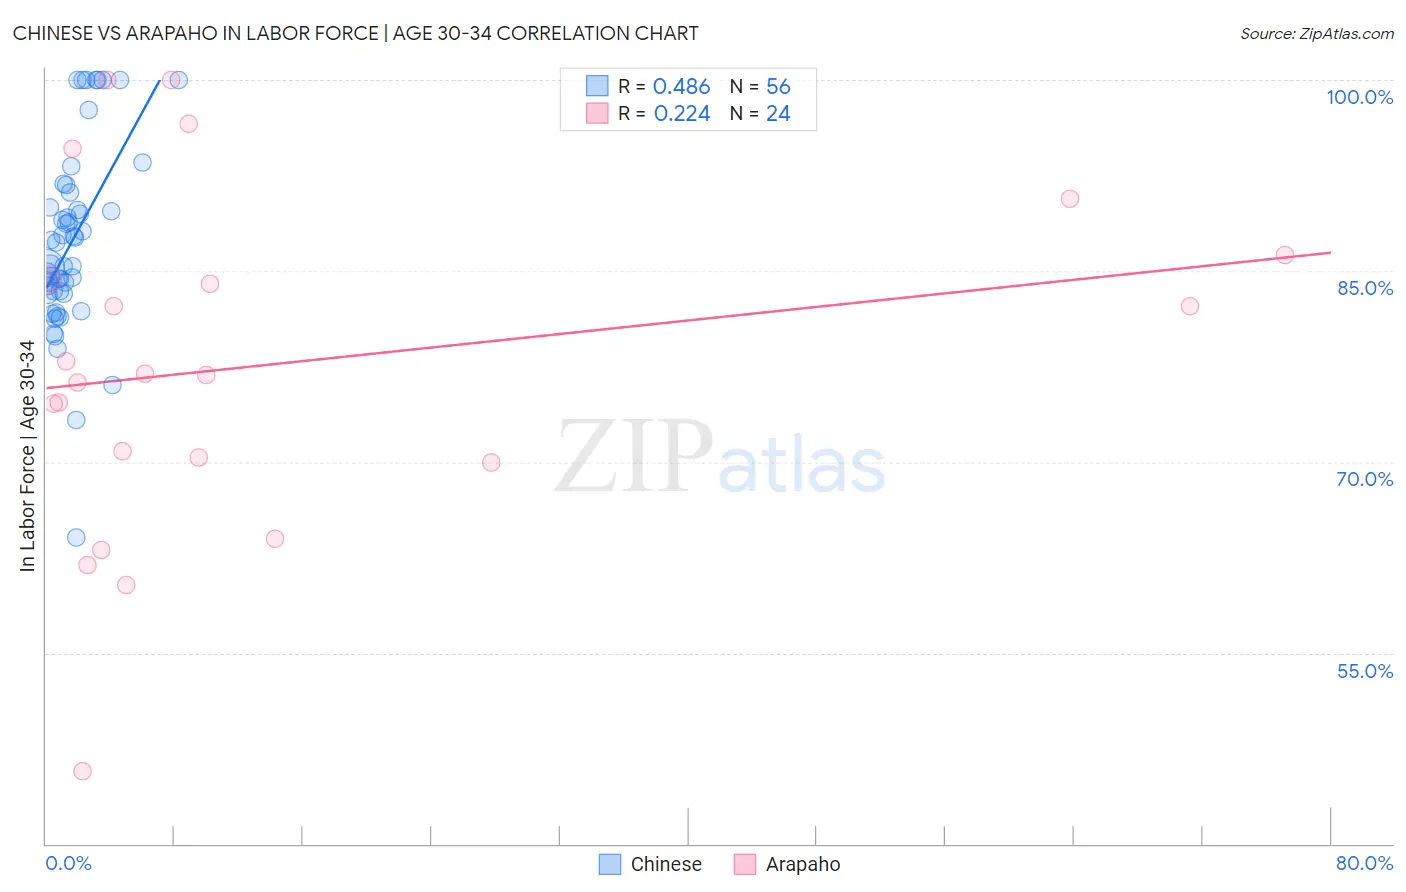
Chinese vs Arapaho In Labor Force | Age 30-34 Correlation Chart
The statistical analysis conducted on geographies consisting of 64,801,795 people shows a moderate positive correlation between the proportion of Chinese and labor force participation rate among population between the ages 30 and 34 in the United States with a correlation coefficient (R) of 0.486 and weighted average of 85.0%. Similarly, the statistical analysis conducted on geographies consisting of 29,773,320 people shows a weak positive correlation between the proportion of Arapaho and labor force participation rate among population between the ages 30 and 34 in the United States with a correlation coefficient (R) of 0.224 and weighted average of 81.5%, a difference of 4.3%.
In Labor Force | Age 30-34 Correlation Summary
| Measurement | Chinese | Arapaho |
| Minimum | 64.1% | 45.7% |
| Maximum | 100.0% | 100.0% |
| Range | 35.9% | 54.3% |
| Mean | 87.3% | 77.7% |
| Median | 86.4% | 76.8% |
| Interquartile 25% (IQ1) | 83.3% | 70.2% |
| Interquartile 75% (IQ3) | 90.6% | 85.3% |
| Interquartile Range (IQR) | 7.3% | 15.1% |
| Standard Deviation (Sample) | 7.3% | 13.5% |
| Standard Deviation (Population) | 7.3% | 13.2% |
Similar Demographics by In Labor Force | Age 30-34
Demographics Similar to Chinese by In Labor Force | Age 30-34
In terms of in labor force | age 30-34, the demographic groups most similar to Chinese are Immigrants from Israel (85.0%, a difference of 0.0%), New Zealander (85.0%, a difference of 0.0%), Immigrants from Western Africa (85.0%, a difference of 0.010%), Immigrants from Spain (85.0%, a difference of 0.010%), and Immigrants from Chile (85.0%, a difference of 0.010%).
| Demographics | Rating | Rank | In Labor Force | Age 30-34 |
| Australians | 92.0 /100 | #124 | Exceptional 85.0% |
| Immigrants | Jordan | 91.5 /100 | #125 | Exceptional 85.0% |
| Austrians | 90.9 /100 | #126 | Exceptional 85.0% |
| Slavs | 90.7 /100 | #127 | Exceptional 85.0% |
| Immigrants | Argentina | 90.6 /100 | #128 | Exceptional 85.0% |
| Immigrants | Western Africa | 90.2 /100 | #129 | Exceptional 85.0% |
| Immigrants | Spain | 90.0 /100 | #130 | Exceptional 85.0% |
| Chinese | 89.6 /100 | #131 | Excellent 85.0% |
| Immigrants | Israel | 89.5 /100 | #132 | Excellent 85.0% |
| New Zealanders | 89.5 /100 | #133 | Excellent 85.0% |
| Immigrants | Chile | 89.2 /100 | #134 | Excellent 85.0% |
| Immigrants | Asia | 88.9 /100 | #135 | Excellent 85.0% |
| Jordanians | 88.6 /100 | #136 | Excellent 85.0% |
| South Africans | 88.0 /100 | #137 | Excellent 85.0% |
| Sri Lankans | 87.8 /100 | #138 | Excellent 85.0% |
Demographics Similar to Arapaho by In Labor Force | Age 30-34
In terms of in labor force | age 30-34, the demographic groups most similar to Arapaho are Immigrants from the Azores (81.5%, a difference of 0.010%), Choctaw (81.4%, a difference of 0.080%), Shoshone (81.4%, a difference of 0.080%), Yaqui (81.4%, a difference of 0.10%), and Cherokee (81.6%, a difference of 0.16%).
| Demographics | Rating | Rank | In Labor Force | Age 30-34 |
| Cajuns | 0.0 /100 | #310 | Tragic 82.0% |
| Chickasaw | 0.0 /100 | #311 | Tragic 81.9% |
| Mexicans | 0.0 /100 | #312 | Tragic 81.9% |
| Iroquois | 0.0 /100 | #313 | Tragic 81.9% |
| Alaskan Athabascans | 0.0 /100 | #314 | Tragic 81.7% |
| Cherokee | 0.0 /100 | #315 | Tragic 81.6% |
| Immigrants | Azores | 0.0 /100 | #316 | Tragic 81.5% |
| Arapaho | 0.0 /100 | #317 | Tragic 81.5% |
| Choctaw | 0.0 /100 | #318 | Tragic 81.4% |
| Shoshone | 0.0 /100 | #319 | Tragic 81.4% |
| Yaqui | 0.0 /100 | #320 | Tragic 81.4% |
| Alaska Natives | 0.0 /100 | #321 | Tragic 81.3% |
| Puerto Ricans | 0.0 /100 | #322 | Tragic 81.2% |
| Paiute | 0.0 /100 | #323 | Tragic 81.2% |
| Cheyenne | 0.0 /100 | #324 | Tragic 81.1% |