Chilean vs Immigrants from Sudan In Labor Force | Age 25-29
COMPARE
Chilean
Immigrants from Sudan
In Labor Force | Age 25-29
In Labor Force | Age 25-29 Comparison
Chileans
Immigrants from Sudan
85.0%
IN LABOR FORCE | AGE 25-29
88.8/ 100
METRIC RATING
116th/ 347
METRIC RANK
85.1%
IN LABOR FORCE | AGE 25-29
94.3/ 100
METRIC RATING
97th/ 347
METRIC RANK
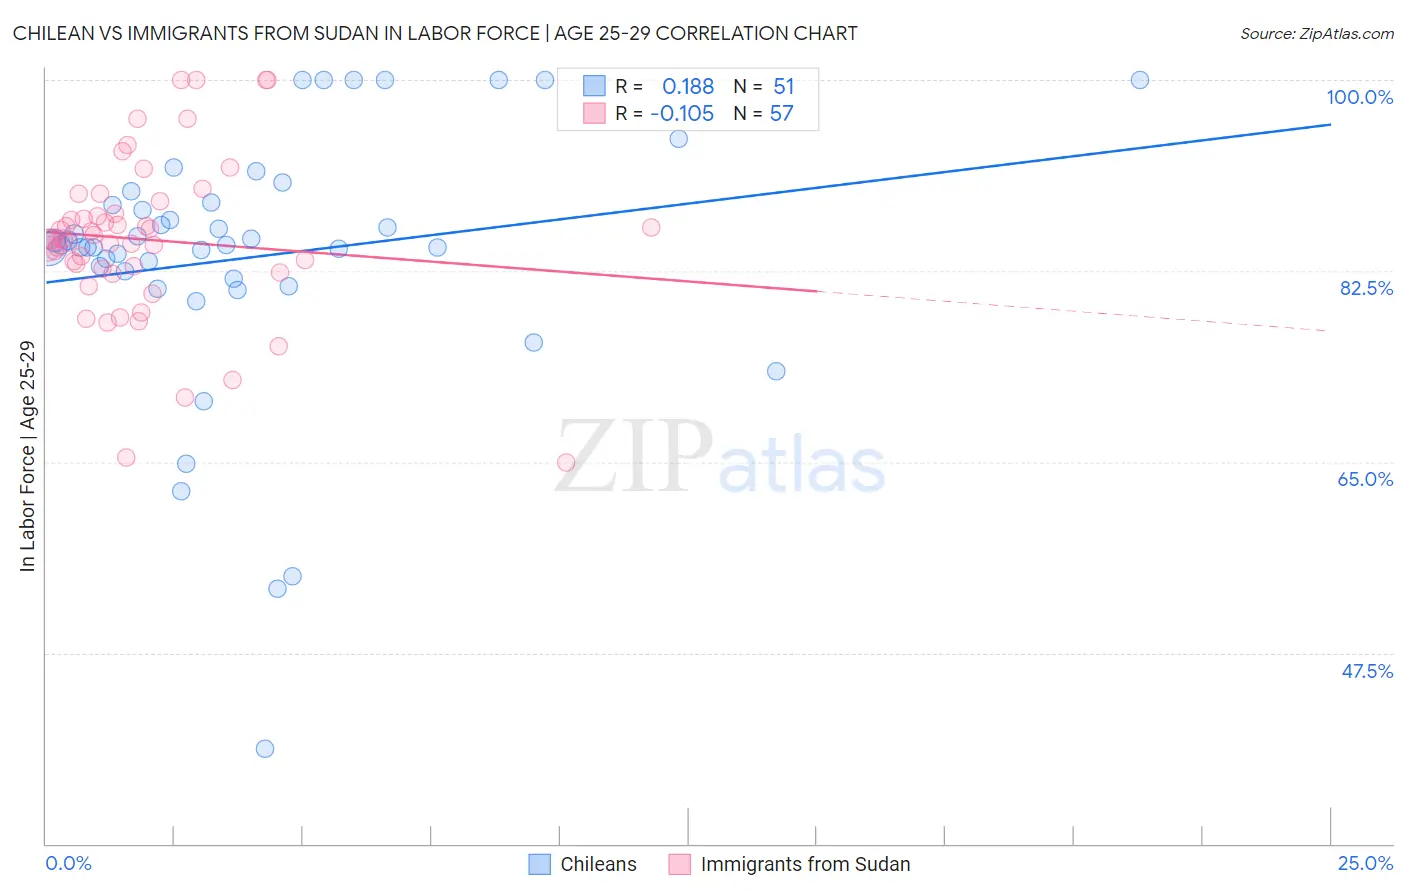
Chilean vs Immigrants from Sudan In Labor Force | Age 25-29 Correlation Chart
The statistical analysis conducted on geographies consisting of 256,647,437 people shows a poor positive correlation between the proportion of Chileans and labor force participation rate among population between the ages 25 and 29 in the United States with a correlation coefficient (R) of 0.188 and weighted average of 85.0%. Similarly, the statistical analysis conducted on geographies consisting of 118,966,602 people shows a poor negative correlation between the proportion of Immigrants from Sudan and labor force participation rate among population between the ages 25 and 29 in the United States with a correlation coefficient (R) of -0.105 and weighted average of 85.1%, a difference of 0.13%.
In Labor Force | Age 25-29 Correlation Summary
| Measurement | Chilean | Immigrants from Sudan |
| Minimum | 38.7% | 64.9% |
| Maximum | 100.0% | 100.0% |
| Range | 61.3% | 35.1% |
| Mean | 83.8% | 85.4% |
| Median | 84.8% | 85.5% |
| Interquartile 25% (IQ1) | 81.8% | 82.6% |
| Interquartile 75% (IQ3) | 88.8% | 88.3% |
| Interquartile Range (IQR) | 7.0% | 5.8% |
| Standard Deviation (Sample) | 12.1% | 7.4% |
| Standard Deviation (Population) | 12.0% | 7.3% |
Demographics Similar to Chileans and Immigrants from Sudan by In Labor Force | Age 25-29
In terms of in labor force | age 25-29, the demographic groups most similar to Chileans are South African (85.0%, a difference of 0.0%), Immigrants from Malaysia (85.0%, a difference of 0.030%), Senegalese (85.0%, a difference of 0.040%), Irish (85.0%, a difference of 0.040%), and Immigrants from Middle Africa (85.0%, a difference of 0.050%). Similarly, the demographic groups most similar to Immigrants from Sudan are Immigrants from Romania (85.1%, a difference of 0.010%), Mongolian (85.1%, a difference of 0.010%), Bangladeshi (85.1%, a difference of 0.010%), Immigrants from Switzerland (85.1%, a difference of 0.010%), and Egyptian (85.1%, a difference of 0.020%).
| Demographics | Rating | Rank | In Labor Force | Age 25-29 |
| Immigrants | Romania | 94.6 /100 | #96 | Exceptional 85.1% |
| Immigrants | Sudan | 94.3 /100 | #97 | Exceptional 85.1% |
| Mongolians | 94.1 /100 | #98 | Exceptional 85.1% |
| Bangladeshis | 94.0 /100 | #99 | Exceptional 85.1% |
| Immigrants | Switzerland | 93.9 /100 | #100 | Exceptional 85.1% |
| Egyptians | 93.8 /100 | #101 | Exceptional 85.1% |
| Slavs | 93.7 /100 | #102 | Exceptional 85.1% |
| Immigrants | Japan | 93.5 /100 | #103 | Exceptional 85.1% |
| Immigrants | Zaire | 93.3 /100 | #104 | Exceptional 85.1% |
| Immigrants | Hong Kong | 92.8 /100 | #105 | Exceptional 85.0% |
| Czechoslovakians | 92.6 /100 | #106 | Exceptional 85.0% |
| Immigrants | Southern Europe | 92.3 /100 | #107 | Exceptional 85.0% |
| Immigrants | Austria | 91.9 /100 | #108 | Exceptional 85.0% |
| Costa Ricans | 91.9 /100 | #109 | Exceptional 85.0% |
| New Zealanders | 91.5 /100 | #110 | Exceptional 85.0% |
| Immigrants | Middle Africa | 91.4 /100 | #111 | Exceptional 85.0% |
| Senegalese | 90.9 /100 | #112 | Exceptional 85.0% |
| Irish | 90.6 /100 | #113 | Exceptional 85.0% |
| Immigrants | Malaysia | 90.4 /100 | #114 | Exceptional 85.0% |
| South Africans | 88.9 /100 | #115 | Excellent 85.0% |
| Chileans | 88.8 /100 | #116 | Excellent 85.0% |