Chilean vs Immigrants from Sudan 4th Grade
COMPARE
Chilean
Immigrants from Sudan
4th Grade
4th Grade Comparison
Chileans
Immigrants from Sudan
97.5%
4TH GRADE
54.4/ 100
METRIC RATING
169th/ 347
METRIC RANK
97.2%
4TH GRADE
5.0/ 100
METRIC RATING
223rd/ 347
METRIC RANK
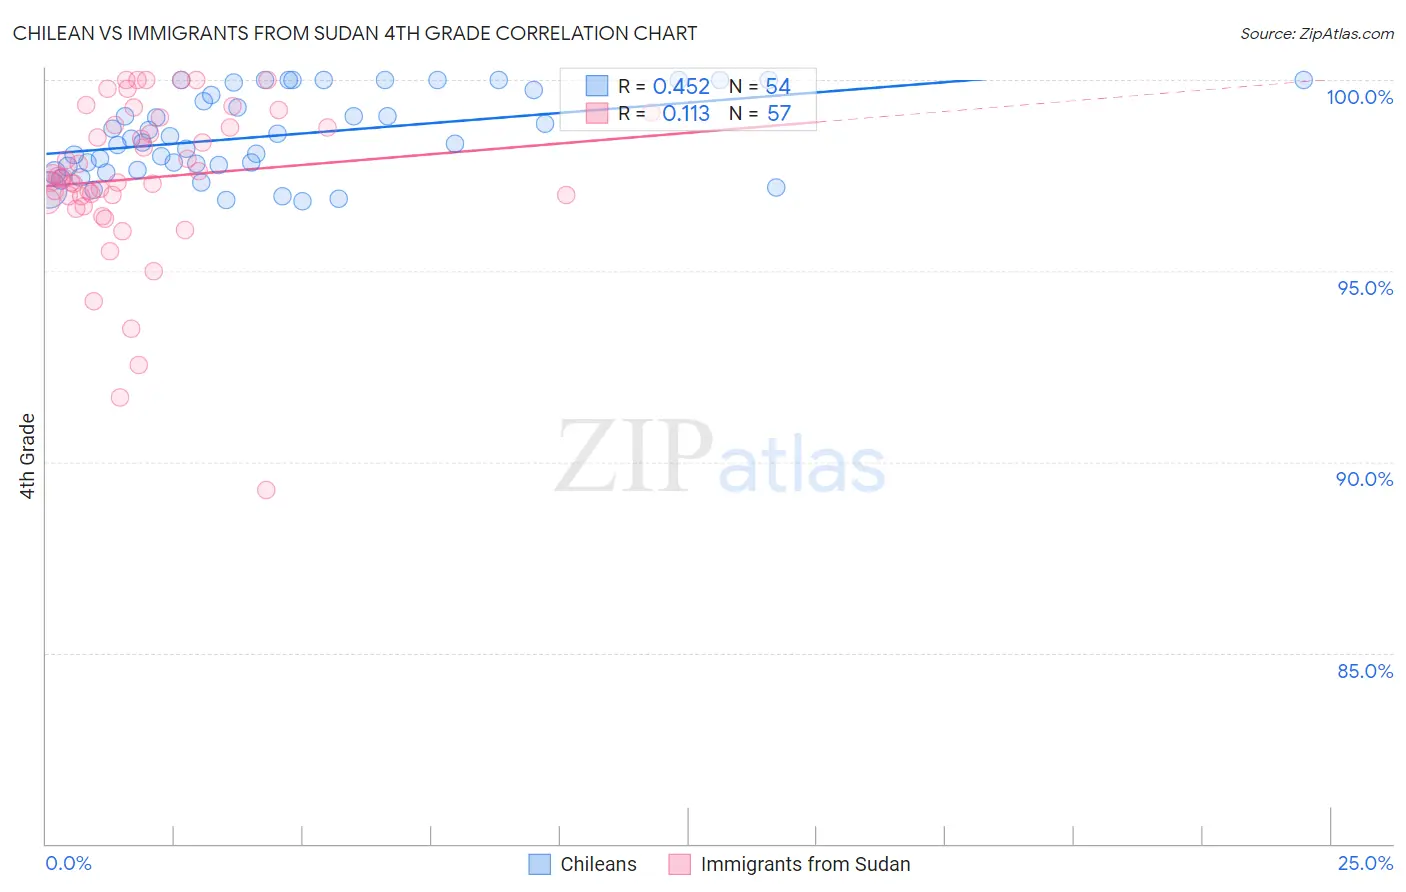
Chilean vs Immigrants from Sudan 4th Grade Correlation Chart
The statistical analysis conducted on geographies consisting of 256,683,580 people shows a moderate positive correlation between the proportion of Chileans and percentage of population with at least 4th grade education in the United States with a correlation coefficient (R) of 0.452 and weighted average of 97.5%. Similarly, the statistical analysis conducted on geographies consisting of 118,959,807 people shows a poor positive correlation between the proportion of Immigrants from Sudan and percentage of population with at least 4th grade education in the United States with a correlation coefficient (R) of 0.113 and weighted average of 97.2%, a difference of 0.29%.
4th Grade Correlation Summary
| Measurement | Chilean | Immigrants from Sudan |
| Minimum | 96.8% | 89.3% |
| Maximum | 100.0% | 100.0% |
| Range | 3.2% | 10.7% |
| Mean | 98.6% | 97.4% |
| Median | 98.4% | 97.4% |
| Interquartile 25% (IQ1) | 97.7% | 96.9% |
| Interquartile 75% (IQ3) | 99.8% | 98.9% |
| Interquartile Range (IQR) | 2.0% | 2.0% |
| Standard Deviation (Sample) | 1.1% | 2.1% |
| Standard Deviation (Population) | 1.1% | 2.1% |
Similar Demographics by 4th Grade
Demographics Similar to Chileans by 4th Grade
In terms of 4th grade, the demographic groups most similar to Chileans are Kenyan (97.5%, a difference of 0.010%), Immigrants from Poland (97.5%, a difference of 0.010%), Immigrants from Belarus (97.5%, a difference of 0.010%), Immigrants from Spain (97.5%, a difference of 0.010%), and Brazilian (97.5%, a difference of 0.010%).
| Demographics | Rating | Rank | 4th Grade |
| Bermudans | 60.5 /100 | #162 | Good 97.6% |
| Immigrants | Iran | 60.3 /100 | #163 | Good 97.6% |
| Ugandans | 58.9 /100 | #164 | Average 97.6% |
| Venezuelans | 58.7 /100 | #165 | Average 97.6% |
| Kenyans | 56.5 /100 | #166 | Average 97.5% |
| Immigrants | Poland | 55.9 /100 | #167 | Average 97.5% |
| Immigrants | Belarus | 55.8 /100 | #168 | Average 97.5% |
| Chileans | 54.4 /100 | #169 | Average 97.5% |
| Immigrants | Spain | 51.8 /100 | #170 | Average 97.5% |
| Brazilians | 51.5 /100 | #171 | Average 97.5% |
| Immigrants | Sri Lanka | 51.1 /100 | #172 | Average 97.5% |
| Immigrants | Korea | 50.6 /100 | #173 | Average 97.5% |
| Egyptians | 50.0 /100 | #174 | Average 97.5% |
| Immigrants | Micronesia | 49.6 /100 | #175 | Average 97.5% |
| Arabs | 48.7 /100 | #176 | Average 97.5% |
Demographics Similar to Immigrants from Sudan by 4th Grade
In terms of 4th grade, the demographic groups most similar to Immigrants from Sudan are Immigrants from Lebanon (97.3%, a difference of 0.0%), Immigrants from Syria (97.2%, a difference of 0.0%), Tongan (97.3%, a difference of 0.010%), South American Indian (97.3%, a difference of 0.010%), and Immigrants from Panama (97.3%, a difference of 0.010%).
| Demographics | Rating | Rank | 4th Grade |
| Samoans | 6.8 /100 | #216 | Tragic 97.3% |
| Sierra Leoneans | 6.5 /100 | #217 | Tragic 97.3% |
| Iraqis | 6.3 /100 | #218 | Tragic 97.3% |
| Tongans | 5.8 /100 | #219 | Tragic 97.3% |
| South American Indians | 5.5 /100 | #220 | Tragic 97.3% |
| Immigrants | Panama | 5.4 /100 | #221 | Tragic 97.3% |
| Immigrants | Lebanon | 5.1 /100 | #222 | Tragic 97.3% |
| Immigrants | Sudan | 5.0 /100 | #223 | Tragic 97.2% |
| Immigrants | Syria | 5.0 /100 | #224 | Tragic 97.2% |
| Immigrants | Iraq | 4.6 /100 | #225 | Tragic 97.2% |
| Bahamians | 3.8 /100 | #226 | Tragic 97.2% |
| Immigrants | Pakistan | 3.7 /100 | #227 | Tragic 97.2% |
| Sub-Saharan Africans | 3.6 /100 | #228 | Tragic 97.2% |
| Liberians | 3.6 /100 | #229 | Tragic 97.2% |
| Uruguayans | 3.5 /100 | #230 | Tragic 97.2% |