Chilean vs Immigrants from South Central Asia In Labor Force | Age 25-29
COMPARE
Chilean
Immigrants from South Central Asia
In Labor Force | Age 25-29
In Labor Force | Age 25-29 Comparison
Chileans
Immigrants from South Central Asia
85.0%
IN LABOR FORCE | AGE 25-29
88.8/ 100
METRIC RATING
116th/ 347
METRIC RANK
85.2%
IN LABOR FORCE | AGE 25-29
97.9/ 100
METRIC RATING
77th/ 347
METRIC RANK
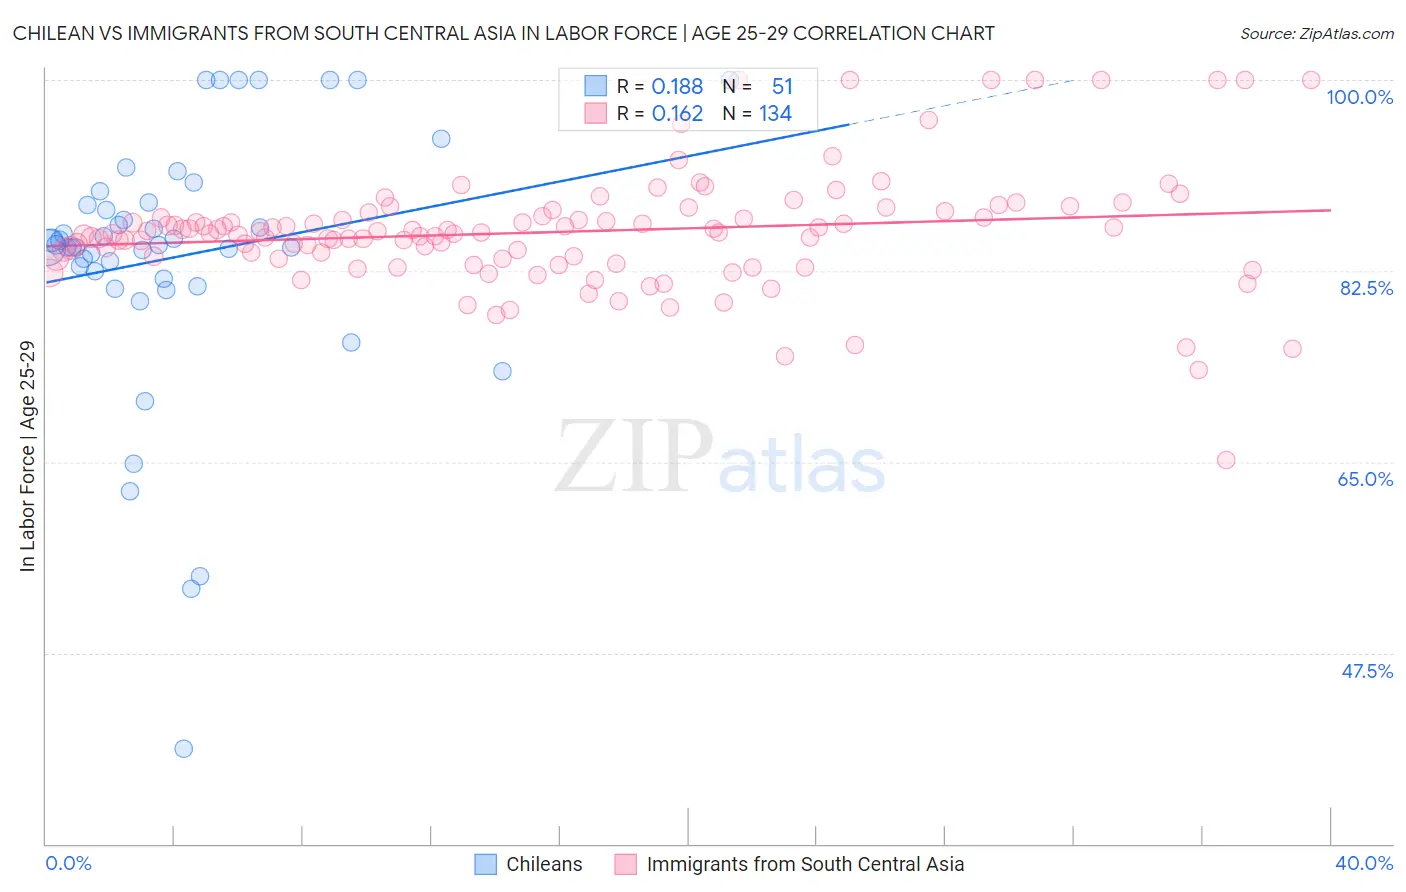
Chilean vs Immigrants from South Central Asia In Labor Force | Age 25-29 Correlation Chart
The statistical analysis conducted on geographies consisting of 256,647,437 people shows a poor positive correlation between the proportion of Chileans and labor force participation rate among population between the ages 25 and 29 in the United States with a correlation coefficient (R) of 0.188 and weighted average of 85.0%. Similarly, the statistical analysis conducted on geographies consisting of 472,851,475 people shows a poor positive correlation between the proportion of Immigrants from South Central Asia and labor force participation rate among population between the ages 25 and 29 in the United States with a correlation coefficient (R) of 0.162 and weighted average of 85.2%, a difference of 0.32%.
In Labor Force | Age 25-29 Correlation Summary
| Measurement | Chilean | Immigrants from South Central Asia |
| Minimum | 38.7% | 65.2% |
| Maximum | 100.0% | 100.0% |
| Range | 61.3% | 34.8% |
| Mean | 83.8% | 86.1% |
| Median | 84.8% | 86.0% |
| Interquartile 25% (IQ1) | 81.8% | 83.7% |
| Interquartile 75% (IQ3) | 88.8% | 87.5% |
| Interquartile Range (IQR) | 7.0% | 3.7% |
| Standard Deviation (Sample) | 12.1% | 5.3% |
| Standard Deviation (Population) | 12.0% | 5.3% |
Similar Demographics by In Labor Force | Age 25-29
Demographics Similar to Chileans by In Labor Force | Age 25-29
In terms of in labor force | age 25-29, the demographic groups most similar to Chileans are South African (85.0%, a difference of 0.0%), Immigrants from Belarus (85.0%, a difference of 0.020%), Finnish (85.0%, a difference of 0.020%), Immigrants from Malaysia (85.0%, a difference of 0.030%), and Filipino (84.9%, a difference of 0.030%).
| Demographics | Rating | Rank | In Labor Force | Age 25-29 |
| Costa Ricans | 91.9 /100 | #109 | Exceptional 85.0% |
| New Zealanders | 91.5 /100 | #110 | Exceptional 85.0% |
| Immigrants | Middle Africa | 91.4 /100 | #111 | Exceptional 85.0% |
| Senegalese | 90.9 /100 | #112 | Exceptional 85.0% |
| Irish | 90.6 /100 | #113 | Exceptional 85.0% |
| Immigrants | Malaysia | 90.4 /100 | #114 | Exceptional 85.0% |
| South Africans | 88.9 /100 | #115 | Excellent 85.0% |
| Chileans | 88.8 /100 | #116 | Excellent 85.0% |
| Immigrants | Belarus | 88.0 /100 | #117 | Excellent 85.0% |
| Finns | 87.8 /100 | #118 | Excellent 85.0% |
| Filipinos | 87.1 /100 | #119 | Excellent 84.9% |
| Immigrants | South Africa | 86.1 /100 | #120 | Excellent 84.9% |
| Immigrants | Chile | 85.6 /100 | #121 | Excellent 84.9% |
| Scandinavians | 85.1 /100 | #122 | Excellent 84.9% |
| Dutch | 84.9 /100 | #123 | Excellent 84.9% |
Demographics Similar to Immigrants from South Central Asia by In Labor Force | Age 25-29
In terms of in labor force | age 25-29, the demographic groups most similar to Immigrants from South Central Asia are German (85.3%, a difference of 0.020%), Immigrants from Egypt (85.2%, a difference of 0.020%), Immigrants from Northern Africa (85.2%, a difference of 0.020%), Immigrants from Zimbabwe (85.2%, a difference of 0.030%), and Brazilian (85.3%, a difference of 0.040%).
| Demographics | Rating | Rank | In Labor Force | Age 25-29 |
| Immigrants | Sweden | 99.1 /100 | #70 | Exceptional 85.4% |
| Kenyans | 99.0 /100 | #71 | Exceptional 85.4% |
| Immigrants | Australia | 98.9 /100 | #72 | Exceptional 85.3% |
| Russians | 98.8 /100 | #73 | Exceptional 85.3% |
| Soviet Union | 98.5 /100 | #74 | Exceptional 85.3% |
| Brazilians | 98.3 /100 | #75 | Exceptional 85.3% |
| Germans | 98.1 /100 | #76 | Exceptional 85.3% |
| Immigrants | South Central Asia | 97.9 /100 | #77 | Exceptional 85.2% |
| Immigrants | Egypt | 97.7 /100 | #78 | Exceptional 85.2% |
| Immigrants | Northern Africa | 97.6 /100 | #79 | Exceptional 85.2% |
| Immigrants | Zimbabwe | 97.6 /100 | #80 | Exceptional 85.2% |
| Immigrants | Northern Europe | 97.2 /100 | #81 | Exceptional 85.2% |
| Okinawans | 97.0 /100 | #82 | Exceptional 85.2% |
| Immigrants | Europe | 96.8 /100 | #83 | Exceptional 85.2% |
| Immigrants | Eastern Europe | 96.8 /100 | #84 | Exceptional 85.2% |