Chilean vs Houma In Labor Force | Age 25-29
COMPARE
Chilean
Houma
In Labor Force | Age 25-29
In Labor Force | Age 25-29 Comparison
Chileans
Houma
85.0%
IN LABOR FORCE | AGE 25-29
88.8/ 100
METRIC RATING
116th/ 347
METRIC RANK
81.2%
IN LABOR FORCE | AGE 25-29
0.0/ 100
METRIC RATING
324th/ 347
METRIC RANK
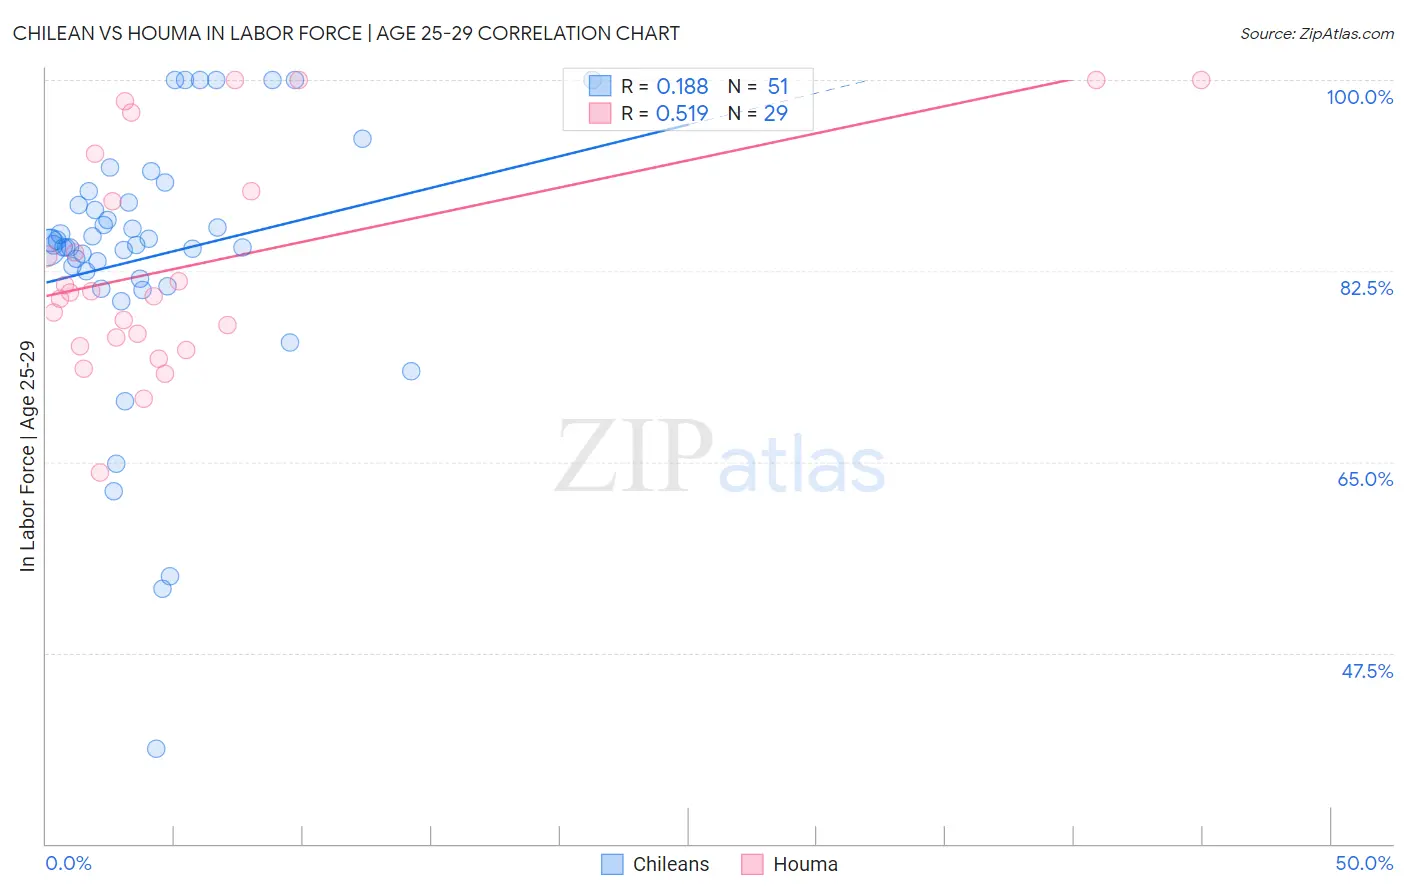
Chilean vs Houma In Labor Force | Age 25-29 Correlation Chart
The statistical analysis conducted on geographies consisting of 256,647,437 people shows a poor positive correlation between the proportion of Chileans and labor force participation rate among population between the ages 25 and 29 in the United States with a correlation coefficient (R) of 0.188 and weighted average of 85.0%. Similarly, the statistical analysis conducted on geographies consisting of 36,788,935 people shows a substantial positive correlation between the proportion of Houma and labor force participation rate among population between the ages 25 and 29 in the United States with a correlation coefficient (R) of 0.519 and weighted average of 81.2%, a difference of 4.6%.
In Labor Force | Age 25-29 Correlation Summary
| Measurement | Chilean | Houma |
| Minimum | 38.7% | 64.0% |
| Maximum | 100.0% | 100.0% |
| Range | 61.3% | 36.0% |
| Mean | 83.8% | 83.2% |
| Median | 84.8% | 80.5% |
| Interquartile 25% (IQ1) | 81.8% | 76.0% |
| Interquartile 75% (IQ3) | 88.8% | 91.5% |
| Interquartile Range (IQR) | 7.0% | 15.5% |
| Standard Deviation (Sample) | 12.1% | 10.1% |
| Standard Deviation (Population) | 12.0% | 9.9% |
Similar Demographics by In Labor Force | Age 25-29
Demographics Similar to Chileans by In Labor Force | Age 25-29
In terms of in labor force | age 25-29, the demographic groups most similar to Chileans are South African (85.0%, a difference of 0.0%), Immigrants from Belarus (85.0%, a difference of 0.020%), Finnish (85.0%, a difference of 0.020%), Immigrants from Malaysia (85.0%, a difference of 0.030%), and Filipino (84.9%, a difference of 0.030%).
| Demographics | Rating | Rank | In Labor Force | Age 25-29 |
| Costa Ricans | 91.9 /100 | #109 | Exceptional 85.0% |
| New Zealanders | 91.5 /100 | #110 | Exceptional 85.0% |
| Immigrants | Middle Africa | 91.4 /100 | #111 | Exceptional 85.0% |
| Senegalese | 90.9 /100 | #112 | Exceptional 85.0% |
| Irish | 90.6 /100 | #113 | Exceptional 85.0% |
| Immigrants | Malaysia | 90.4 /100 | #114 | Exceptional 85.0% |
| South Africans | 88.9 /100 | #115 | Excellent 85.0% |
| Chileans | 88.8 /100 | #116 | Excellent 85.0% |
| Immigrants | Belarus | 88.0 /100 | #117 | Excellent 85.0% |
| Finns | 87.8 /100 | #118 | Excellent 85.0% |
| Filipinos | 87.1 /100 | #119 | Excellent 84.9% |
| Immigrants | South Africa | 86.1 /100 | #120 | Excellent 84.9% |
| Immigrants | Chile | 85.6 /100 | #121 | Excellent 84.9% |
| Scandinavians | 85.1 /100 | #122 | Excellent 84.9% |
| Dutch | 84.9 /100 | #123 | Excellent 84.9% |
Demographics Similar to Houma by In Labor Force | Age 25-29
In terms of in labor force | age 25-29, the demographic groups most similar to Houma are Dutch West Indian (81.1%, a difference of 0.11%), Choctaw (81.0%, a difference of 0.32%), Alaska Native (81.6%, a difference of 0.41%), Kiowa (81.6%, a difference of 0.45%), and Shoshone (81.6%, a difference of 0.46%).
| Demographics | Rating | Rank | In Labor Force | Age 25-29 |
| Chickasaw | 0.0 /100 | #317 | Tragic 81.9% |
| Comanche | 0.0 /100 | #318 | Tragic 81.9% |
| Seminole | 0.0 /100 | #319 | Tragic 81.7% |
| Colville | 0.0 /100 | #320 | Tragic 81.6% |
| Shoshone | 0.0 /100 | #321 | Tragic 81.6% |
| Kiowa | 0.0 /100 | #322 | Tragic 81.6% |
| Alaska Natives | 0.0 /100 | #323 | Tragic 81.6% |
| Houma | 0.0 /100 | #324 | Tragic 81.2% |
| Dutch West Indians | 0.0 /100 | #325 | Tragic 81.1% |
| Choctaw | 0.0 /100 | #326 | Tragic 81.0% |
| Ute | 0.0 /100 | #327 | Tragic 80.8% |
| Creek | 0.0 /100 | #328 | Tragic 80.7% |
| Yakama | 0.0 /100 | #329 | Tragic 80.6% |
| Puerto Ricans | 0.0 /100 | #330 | Tragic 80.4% |
| Cheyenne | 0.0 /100 | #331 | Tragic 80.3% |