Tohono O'odham vs Romanian In Labor Force | Age 25-29
COMPARE
Tohono O'odham
Romanian
In Labor Force | Age 25-29
In Labor Force | Age 25-29 Comparison
Tohono O'odham
Romanians
77.5%
IN LABOR FORCE | AGE 25-29
0.0/ 100
METRIC RATING
341st/ 347
METRIC RANK
84.8%
IN LABOR FORCE | AGE 25-29
77.7/ 100
METRIC RATING
132nd/ 347
METRIC RANK
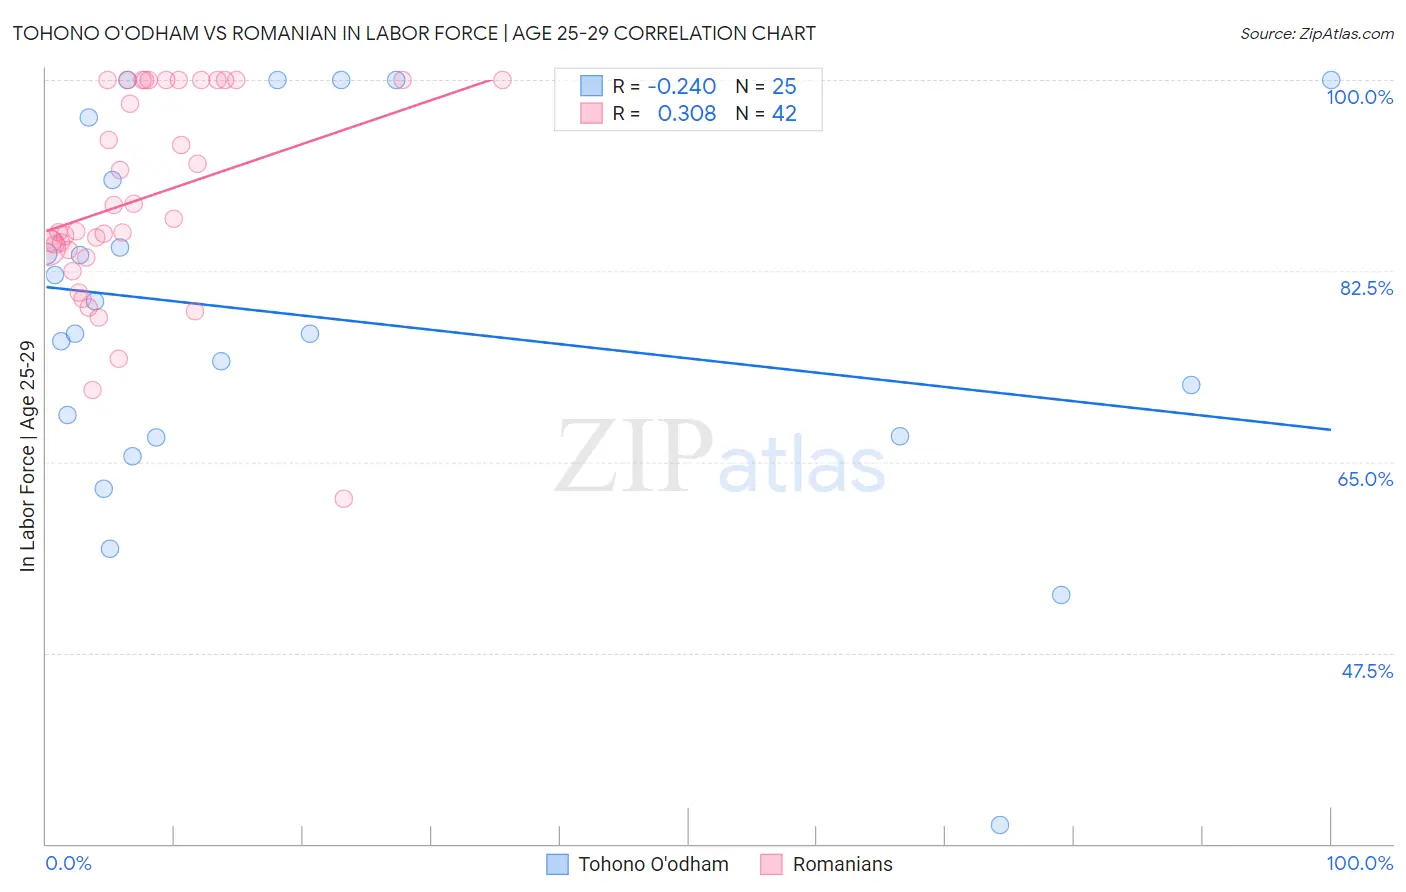
Tohono O'odham vs Romanian In Labor Force | Age 25-29 Correlation Chart
The statistical analysis conducted on geographies consisting of 58,719,537 people shows a weak negative correlation between the proportion of Tohono O'odham and labor force participation rate among population between the ages 25 and 29 in the United States with a correlation coefficient (R) of -0.240 and weighted average of 77.5%. Similarly, the statistical analysis conducted on geographies consisting of 377,759,265 people shows a mild positive correlation between the proportion of Romanians and labor force participation rate among population between the ages 25 and 29 in the United States with a correlation coefficient (R) of 0.308 and weighted average of 84.8%, a difference of 9.5%.
In Labor Force | Age 25-29 Correlation Summary
| Measurement | Tohono O'odham | Romanian |
| Minimum | 31.7% | 61.6% |
| Maximum | 100.0% | 100.0% |
| Range | 68.3% | 38.4% |
| Mean | 78.0% | 89.2% |
| Median | 76.8% | 86.7% |
| Interquartile 25% (IQ1) | 67.3% | 84.4% |
| Interquartile 75% (IQ3) | 93.7% | 100.0% |
| Interquartile Range (IQR) | 26.4% | 15.6% |
| Standard Deviation (Sample) | 17.1% | 9.5% |
| Standard Deviation (Population) | 16.8% | 9.4% |
Similar Demographics by In Labor Force | Age 25-29
Demographics Similar to Tohono O'odham by In Labor Force | Age 25-29
In terms of in labor force | age 25-29, the demographic groups most similar to Tohono O'odham are Pueblo (77.5%, a difference of 0.010%), Paiute (78.1%, a difference of 0.78%), Immigrants from Yemen (78.2%, a difference of 0.94%), Lumbee (78.3%, a difference of 1.1%), and Arapaho (76.6%, a difference of 1.2%).
| Demographics | Rating | Rank | In Labor Force | Age 25-29 |
| Sioux | 0.0 /100 | #333 | Tragic 79.7% |
| Yuman | 0.0 /100 | #334 | Tragic 79.3% |
| Natives/Alaskans | 0.0 /100 | #335 | Tragic 79.3% |
| Apache | 0.0 /100 | #336 | Tragic 79.2% |
| Crow | 0.0 /100 | #337 | Tragic 78.6% |
| Lumbee | 0.0 /100 | #338 | Tragic 78.3% |
| Immigrants | Yemen | 0.0 /100 | #339 | Tragic 78.2% |
| Paiute | 0.0 /100 | #340 | Tragic 78.1% |
| Tohono O'odham | 0.0 /100 | #341 | Tragic 77.5% |
| Pueblo | 0.0 /100 | #342 | Tragic 77.5% |
| Arapaho | 0.0 /100 | #343 | Tragic 76.6% |
| Hopi | 0.0 /100 | #344 | Tragic 76.5% |
| Navajo | 0.0 /100 | #345 | Tragic 74.6% |
| Pima | 0.0 /100 | #346 | Tragic 74.3% |
| Yup'ik | 0.0 /100 | #347 | Tragic 73.1% |
Demographics Similar to Romanians by In Labor Force | Age 25-29
In terms of in labor force | age 25-29, the demographic groups most similar to Romanians are Iranian (84.8%, a difference of 0.0%), Asian (84.8%, a difference of 0.0%), Syrian (84.8%, a difference of 0.010%), Immigrants from Hungary (84.8%, a difference of 0.010%), and Bhutanese (84.8%, a difference of 0.020%).
| Demographics | Rating | Rank | In Labor Force | Age 25-29 |
| Uruguayans | 84.7 /100 | #125 | Excellent 84.9% |
| Immigrants | Singapore | 84.4 /100 | #126 | Excellent 84.9% |
| Immigrants | Uruguay | 84.0 /100 | #127 | Excellent 84.9% |
| Australians | 83.6 /100 | #128 | Excellent 84.9% |
| Immigrants | Russia | 81.6 /100 | #129 | Excellent 84.9% |
| Northern Europeans | 81.3 /100 | #130 | Excellent 84.9% |
| Iranians | 78.1 /100 | #131 | Good 84.8% |
| Romanians | 77.7 /100 | #132 | Good 84.8% |
| Asians | 77.7 /100 | #133 | Good 84.8% |
| Syrians | 76.5 /100 | #134 | Good 84.8% |
| Immigrants | Hungary | 76.4 /100 | #135 | Good 84.8% |
| Bhutanese | 76.0 /100 | #136 | Good 84.8% |
| Immigrants | Canada | 73.5 /100 | #137 | Good 84.8% |
| Armenians | 72.7 /100 | #138 | Good 84.8% |
| Immigrants | Eastern Asia | 72.6 /100 | #139 | Good 84.8% |