Bermudan vs Immigrants from Asia In Labor Force | Age 20-64
COMPARE
Bermudan
Immigrants from Asia
In Labor Force | Age 20-64
In Labor Force | Age 20-64 Comparison
Bermudans
Immigrants from Asia
80.0%
IN LABOR FORCE | AGE 20-64
93.3/ 100
METRIC RATING
115th/ 347
METRIC RANK
80.1%
IN LABOR FORCE | AGE 20-64
96.0/ 100
METRIC RATING
94th/ 347
METRIC RANK
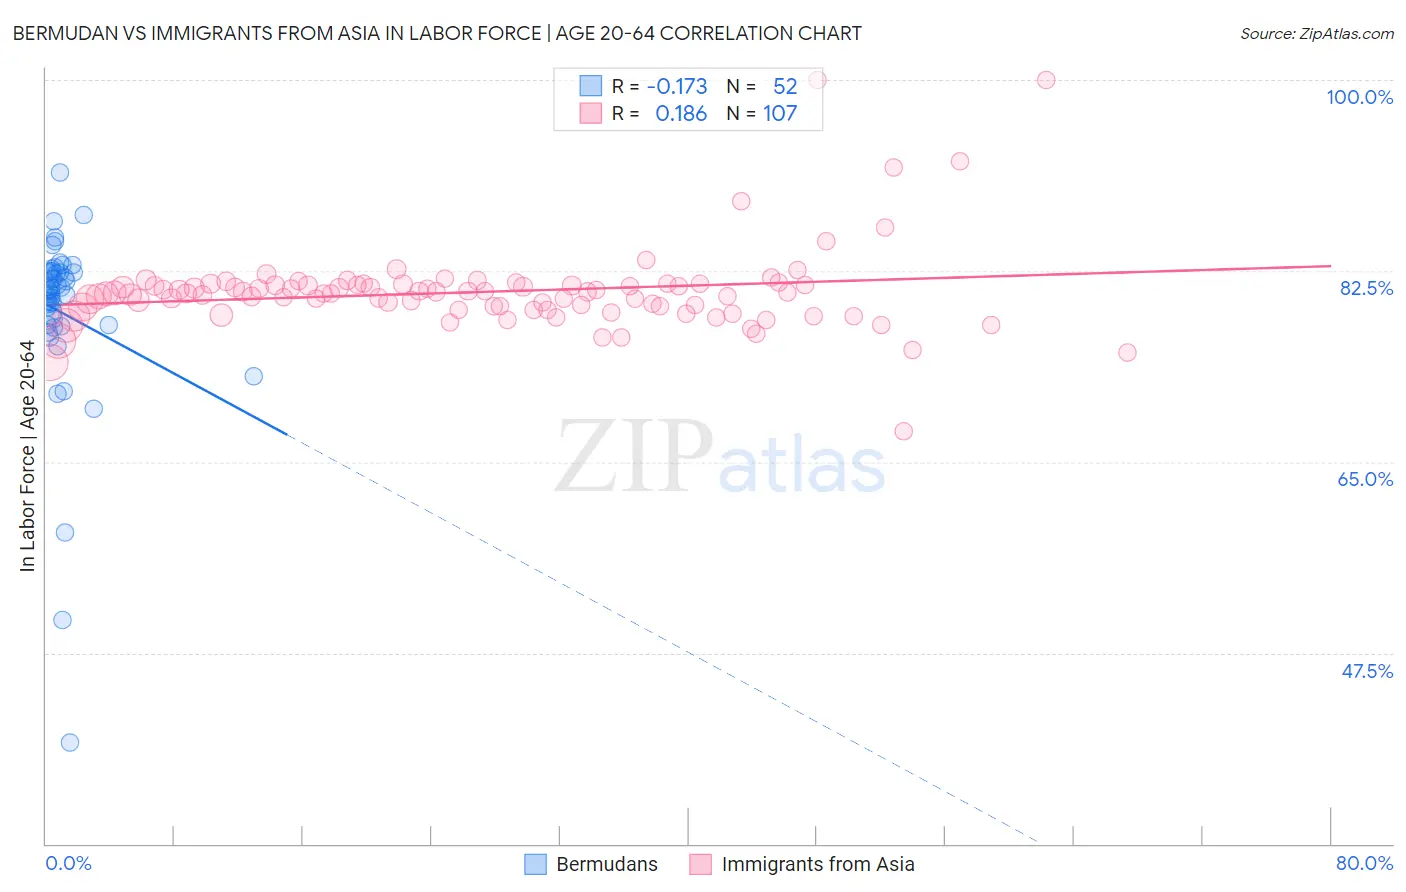
Bermudan vs Immigrants from Asia In Labor Force | Age 20-64 Correlation Chart
The statistical analysis conducted on geographies consisting of 55,730,379 people shows a poor negative correlation between the proportion of Bermudans and labor force participation rate among population between the ages 20 and 64 in the United States with a correlation coefficient (R) of -0.173 and weighted average of 80.0%. Similarly, the statistical analysis conducted on geographies consisting of 549,180,709 people shows a poor positive correlation between the proportion of Immigrants from Asia and labor force participation rate among population between the ages 20 and 64 in the United States with a correlation coefficient (R) of 0.186 and weighted average of 80.1%, a difference of 0.11%.
In Labor Force | Age 20-64 Correlation Summary
| Measurement | Bermudan | Immigrants from Asia |
| Minimum | 39.3% | 67.8% |
| Maximum | 91.5% | 100.0% |
| Range | 52.2% | 32.2% |
| Mean | 78.7% | 80.6% |
| Median | 80.7% | 80.5% |
| Interquartile 25% (IQ1) | 77.5% | 78.9% |
| Interquartile 75% (IQ3) | 82.4% | 81.2% |
| Interquartile Range (IQR) | 4.9% | 2.3% |
| Standard Deviation (Sample) | 8.5% | 3.9% |
| Standard Deviation (Population) | 8.4% | 3.9% |
Similar Demographics by In Labor Force | Age 20-64
Demographics Similar to Bermudans by In Labor Force | Age 20-64
In terms of in labor force | age 20-64, the demographic groups most similar to Bermudans are Immigrants from Western Africa (80.0%, a difference of 0.010%), Estonian (80.0%, a difference of 0.020%), Immigrants from South America (80.0%, a difference of 0.020%), Immigrants from Italy (80.0%, a difference of 0.020%), and Sri Lankan (80.0%, a difference of 0.020%).
| Demographics | Rating | Rank | In Labor Force | Age 20-64 |
| Iranians | 94.3 /100 | #108 | Exceptional 80.0% |
| Immigrants | Argentina | 94.1 /100 | #109 | Exceptional 80.0% |
| Estonians | 94.0 /100 | #110 | Exceptional 80.0% |
| Immigrants | South America | 93.9 /100 | #111 | Exceptional 80.0% |
| Immigrants | Italy | 93.9 /100 | #112 | Exceptional 80.0% |
| Sri Lankans | 93.9 /100 | #113 | Exceptional 80.0% |
| Argentineans | 93.8 /100 | #114 | Exceptional 80.0% |
| Bermudans | 93.3 /100 | #115 | Exceptional 80.0% |
| Immigrants | Western Africa | 93.1 /100 | #116 | Exceptional 80.0% |
| Immigrants | Vietnam | 92.7 /100 | #117 | Exceptional 80.0% |
| Cape Verdeans | 92.7 /100 | #118 | Exceptional 80.0% |
| Immigrants | Taiwan | 92.5 /100 | #119 | Exceptional 80.0% |
| Maltese | 92.4 /100 | #120 | Exceptional 80.0% |
| Immigrants | Kuwait | 92.2 /100 | #121 | Exceptional 80.0% |
| Mongolians | 92.0 /100 | #122 | Exceptional 79.9% |
Demographics Similar to Immigrants from Asia by In Labor Force | Age 20-64
In terms of in labor force | age 20-64, the demographic groups most similar to Immigrants from Asia are Yugoslavian (80.1%, a difference of 0.010%), Immigrants from Malaysia (80.1%, a difference of 0.010%), South American (80.1%, a difference of 0.010%), Immigrants from Uruguay (80.1%, a difference of 0.010%), and Immigrants from Belarus (80.1%, a difference of 0.020%).
| Demographics | Rating | Rank | In Labor Force | Age 20-64 |
| Croatians | 97.1 /100 | #87 | Exceptional 80.1% |
| Chileans | 97.0 /100 | #88 | Exceptional 80.1% |
| Immigrants | Venezuela | 96.8 /100 | #89 | Exceptional 80.1% |
| Poles | 96.8 /100 | #90 | Exceptional 80.1% |
| Uruguayans | 96.7 /100 | #91 | Exceptional 80.1% |
| Ghanaians | 96.7 /100 | #92 | Exceptional 80.1% |
| Immigrants | Belarus | 96.4 /100 | #93 | Exceptional 80.1% |
| Immigrants | Asia | 96.0 /100 | #94 | Exceptional 80.1% |
| Yugoslavians | 95.9 /100 | #95 | Exceptional 80.1% |
| Immigrants | Malaysia | 95.9 /100 | #96 | Exceptional 80.1% |
| South Americans | 95.9 /100 | #97 | Exceptional 80.1% |
| Immigrants | Uruguay | 95.8 /100 | #98 | Exceptional 80.1% |
| Immigrants | Chile | 95.7 /100 | #99 | Exceptional 80.1% |
| Filipinos | 95.6 /100 | #100 | Exceptional 80.1% |
| Palestinians | 95.5 /100 | #101 | Exceptional 80.0% |