South American vs Immigrants from Asia In Labor Force | Age 20-64
COMPARE
South American
Immigrants from Asia
In Labor Force | Age 20-64
In Labor Force | Age 20-64 Comparison
South Americans
Immigrants from Asia
80.1%
IN LABOR FORCE | AGE 20-64
95.9/ 100
METRIC RATING
97th/ 347
METRIC RANK
80.1%
IN LABOR FORCE | AGE 20-64
96.0/ 100
METRIC RATING
94th/ 347
METRIC RANK
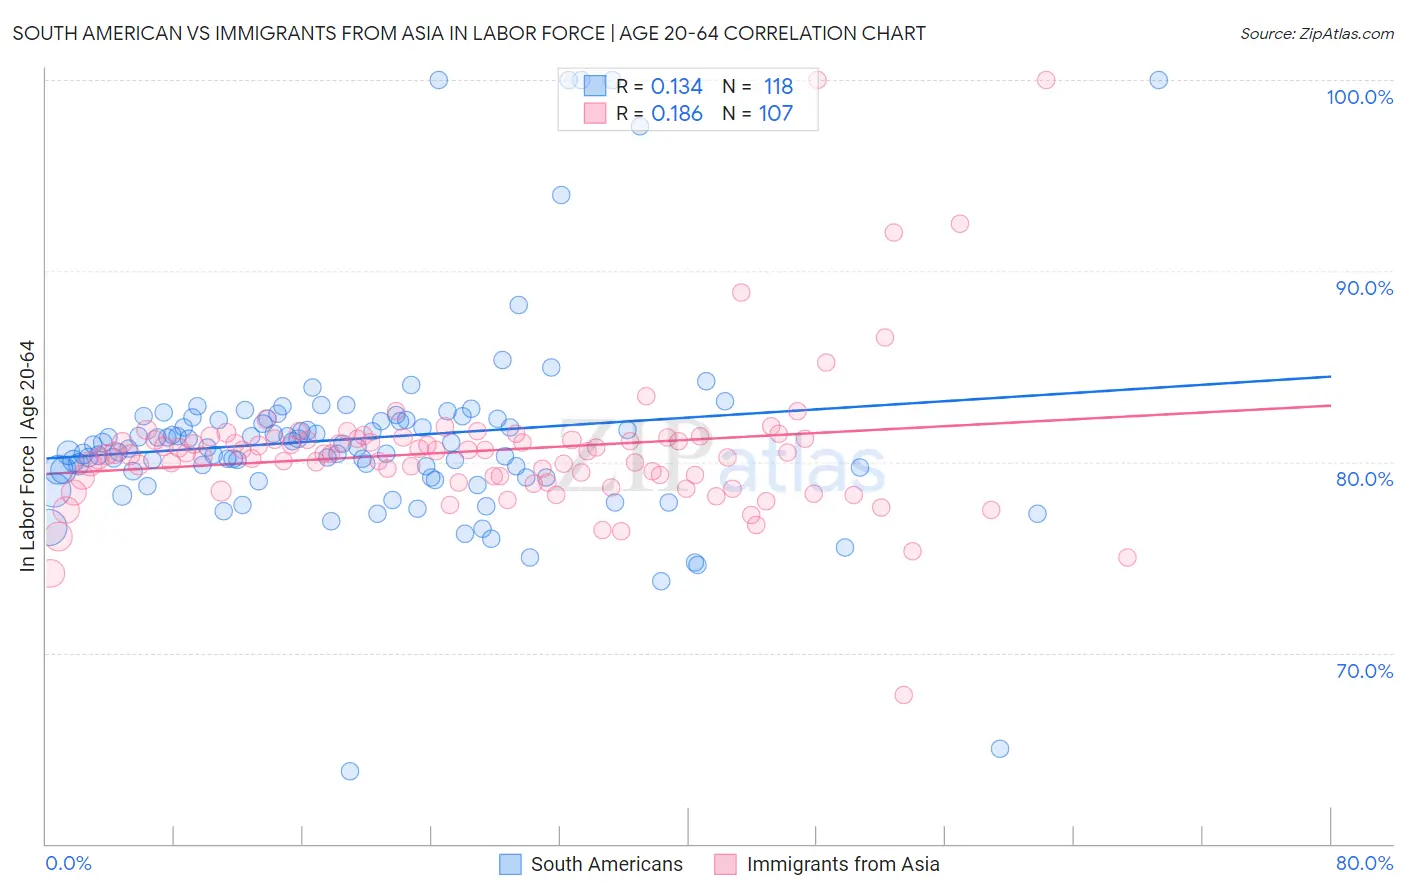
South American vs Immigrants from Asia In Labor Force | Age 20-64 Correlation Chart
The statistical analysis conducted on geographies consisting of 494,183,783 people shows a poor positive correlation between the proportion of South Americans and labor force participation rate among population between the ages 20 and 64 in the United States with a correlation coefficient (R) of 0.134 and weighted average of 80.1%. Similarly, the statistical analysis conducted on geographies consisting of 549,180,709 people shows a poor positive correlation between the proportion of Immigrants from Asia and labor force participation rate among population between the ages 20 and 64 in the United States with a correlation coefficient (R) of 0.186 and weighted average of 80.1%, a difference of 0.010%.
In Labor Force | Age 20-64 Correlation Summary
| Measurement | South American | Immigrants from Asia |
| Minimum | 63.8% | 67.8% |
| Maximum | 100.0% | 100.0% |
| Range | 36.2% | 32.2% |
| Mean | 81.2% | 80.6% |
| Median | 80.7% | 80.5% |
| Interquartile 25% (IQ1) | 79.2% | 78.9% |
| Interquartile 75% (IQ3) | 82.2% | 81.2% |
| Interquartile Range (IQR) | 3.0% | 2.3% |
| Standard Deviation (Sample) | 5.4% | 3.9% |
| Standard Deviation (Population) | 5.4% | 3.9% |
Demographics Similar to South Americans and Immigrants from Asia by In Labor Force | Age 20-64
In terms of in labor force | age 20-64, the demographic groups most similar to South Americans are Yugoslavian (80.1%, a difference of 0.0%), Immigrants from Malaysia (80.1%, a difference of 0.0%), Immigrants from Uruguay (80.1%, a difference of 0.0%), Immigrants from Chile (80.1%, a difference of 0.010%), and Filipino (80.1%, a difference of 0.010%). Similarly, the demographic groups most similar to Immigrants from Asia are Yugoslavian (80.1%, a difference of 0.010%), Immigrants from Malaysia (80.1%, a difference of 0.010%), Immigrants from Uruguay (80.1%, a difference of 0.010%), Immigrants from Belarus (80.1%, a difference of 0.020%), and Immigrants from Chile (80.1%, a difference of 0.020%).
| Demographics | Rating | Rank | In Labor Force | Age 20-64 |
| Jordanians | 97.2 /100 | #85 | Exceptional 80.1% |
| Immigrants | Egypt | 97.1 /100 | #86 | Exceptional 80.1% |
| Croatians | 97.1 /100 | #87 | Exceptional 80.1% |
| Chileans | 97.0 /100 | #88 | Exceptional 80.1% |
| Immigrants | Venezuela | 96.8 /100 | #89 | Exceptional 80.1% |
| Poles | 96.8 /100 | #90 | Exceptional 80.1% |
| Uruguayans | 96.7 /100 | #91 | Exceptional 80.1% |
| Ghanaians | 96.7 /100 | #92 | Exceptional 80.1% |
| Immigrants | Belarus | 96.4 /100 | #93 | Exceptional 80.1% |
| Immigrants | Asia | 96.0 /100 | #94 | Exceptional 80.1% |
| Yugoslavians | 95.9 /100 | #95 | Exceptional 80.1% |
| Immigrants | Malaysia | 95.9 /100 | #96 | Exceptional 80.1% |
| South Americans | 95.9 /100 | #97 | Exceptional 80.1% |
| Immigrants | Uruguay | 95.8 /100 | #98 | Exceptional 80.1% |
| Immigrants | Chile | 95.7 /100 | #99 | Exceptional 80.1% |
| Filipinos | 95.6 /100 | #100 | Exceptional 80.1% |
| Palestinians | 95.5 /100 | #101 | Exceptional 80.0% |
| Immigrants | Australia | 95.5 /100 | #102 | Exceptional 80.0% |
| Russians | 95.5 /100 | #103 | Exceptional 80.0% |
| Venezuelans | 95.3 /100 | #104 | Exceptional 80.0% |
| Immigrants | Ghana | 95.0 /100 | #105 | Exceptional 80.0% |