Belizean vs British In Labor Force | Age 45-54
COMPARE
Belizean
British
In Labor Force | Age 45-54
In Labor Force | Age 45-54 Comparison
Belizeans
British
80.8%
IN LABOR FORCE | AGE 45-54
0.0/ 100
METRIC RATING
284th/ 347
METRIC RANK
82.6%
IN LABOR FORCE | AGE 45-54
25.7/ 100
METRIC RATING
190th/ 347
METRIC RANK
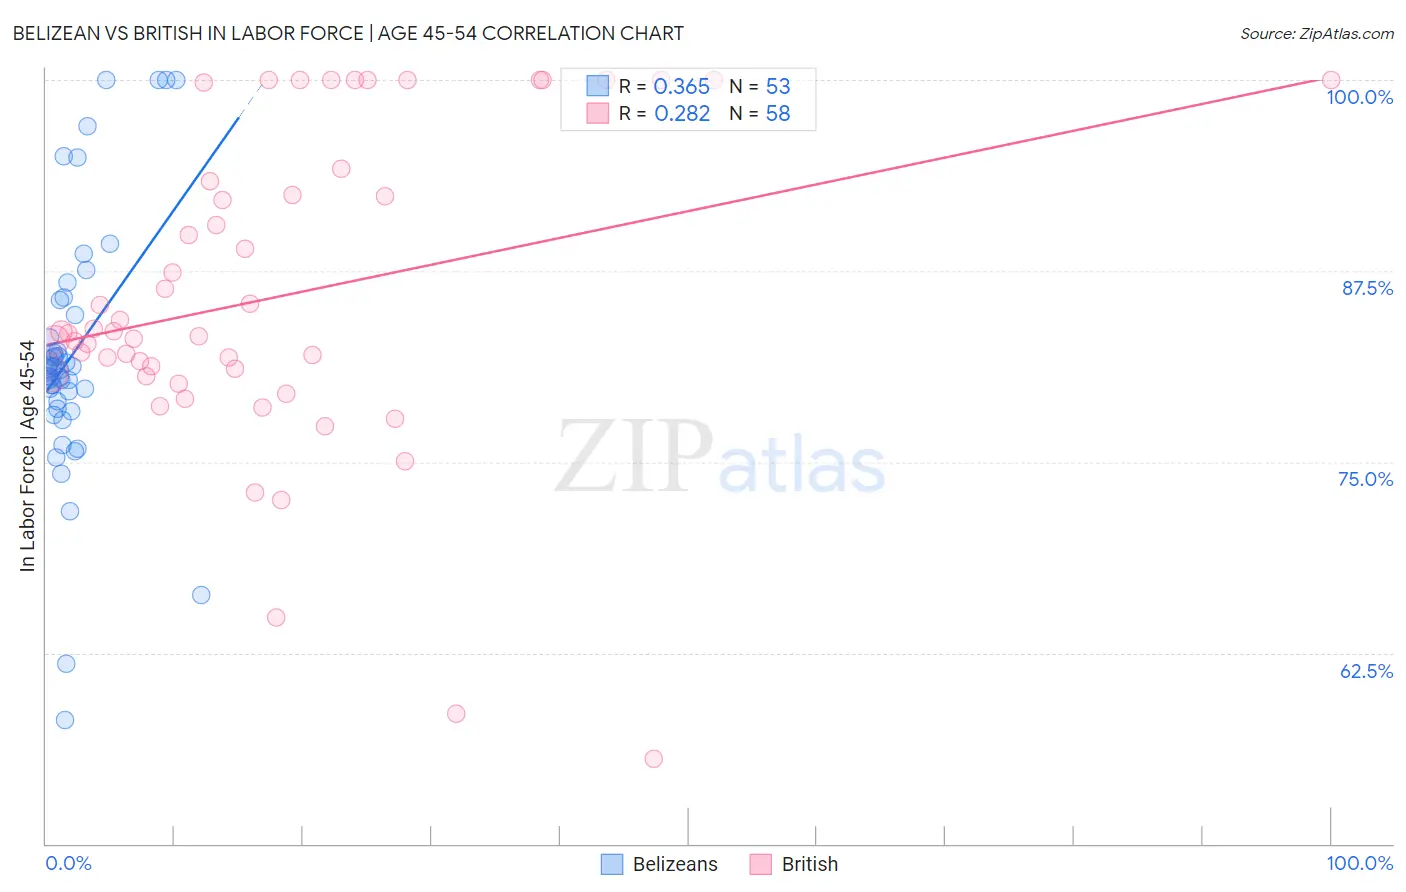
Belizean vs British In Labor Force | Age 45-54 Correlation Chart
The statistical analysis conducted on geographies consisting of 144,162,526 people shows a mild positive correlation between the proportion of Belizeans and labor force participation rate among population between the ages 45 and 54 in the United States with a correlation coefficient (R) of 0.365 and weighted average of 80.8%. Similarly, the statistical analysis conducted on geographies consisting of 530,949,896 people shows a weak positive correlation between the proportion of British and labor force participation rate among population between the ages 45 and 54 in the United States with a correlation coefficient (R) of 0.282 and weighted average of 82.6%, a difference of 2.2%.
In Labor Force | Age 45-54 Correlation Summary
| Measurement | Belizean | British |
| Minimum | 58.1% | 55.6% |
| Maximum | 100.0% | 100.0% |
| Range | 41.9% | 44.4% |
| Mean | 82.0% | 85.8% |
| Median | 81.1% | 83.5% |
| Interquartile 25% (IQ1) | 78.7% | 80.8% |
| Interquartile 75% (IQ3) | 85.1% | 93.4% |
| Interquartile Range (IQR) | 6.4% | 12.6% |
| Standard Deviation (Sample) | 8.4% | 10.3% |
| Standard Deviation (Population) | 8.4% | 10.2% |
Similar Demographics by In Labor Force | Age 45-54
Demographics Similar to Belizeans by In Labor Force | Age 45-54
In terms of in labor force | age 45-54, the demographic groups most similar to Belizeans are Delaware (80.8%, a difference of 0.010%), Immigrants from Dominica (80.8%, a difference of 0.010%), Vietnamese (80.8%, a difference of 0.020%), Cree (80.8%, a difference of 0.020%), and French American Indian (80.8%, a difference of 0.050%).
| Demographics | Rating | Rank | In Labor Force | Age 45-54 |
| Guatemalans | 0.0 /100 | #277 | Tragic 81.2% |
| Immigrants | Guatemala | 0.0 /100 | #278 | Tragic 81.1% |
| Immigrants | Micronesia | 0.0 /100 | #279 | Tragic 81.1% |
| Immigrants | Latin America | 0.0 /100 | #280 | Tragic 81.0% |
| Immigrants | Grenada | 0.0 /100 | #281 | Tragic 81.0% |
| Aleuts | 0.0 /100 | #282 | Tragic 81.0% |
| French American Indians | 0.0 /100 | #283 | Tragic 80.8% |
| Belizeans | 0.0 /100 | #284 | Tragic 80.8% |
| Delaware | 0.0 /100 | #285 | Tragic 80.8% |
| Immigrants | Dominica | 0.0 /100 | #286 | Tragic 80.8% |
| Vietnamese | 0.0 /100 | #287 | Tragic 80.8% |
| Cree | 0.0 /100 | #288 | Tragic 80.8% |
| Immigrants | Bangladesh | 0.0 /100 | #289 | Tragic 80.7% |
| Mexican American Indians | 0.0 /100 | #290 | Tragic 80.7% |
| Immigrants | Belize | 0.0 /100 | #291 | Tragic 80.6% |
Demographics Similar to British by In Labor Force | Age 45-54
In terms of in labor force | age 45-54, the demographic groups most similar to British are Syrian (82.6%, a difference of 0.0%), Immigrants from Costa Rica (82.6%, a difference of 0.030%), South African (82.6%, a difference of 0.030%), Armenian (82.5%, a difference of 0.030%), and Irish (82.6%, a difference of 0.040%).
| Demographics | Rating | Rank | In Labor Force | Age 45-54 |
| New Zealanders | 32.7 /100 | #183 | Fair 82.6% |
| Europeans | 32.6 /100 | #184 | Fair 82.6% |
| Immigrants | England | 32.2 /100 | #185 | Fair 82.6% |
| Irish | 29.2 /100 | #186 | Fair 82.6% |
| Immigrants | Costa Rica | 28.3 /100 | #187 | Fair 82.6% |
| South Africans | 28.0 /100 | #188 | Fair 82.6% |
| Syrians | 26.0 /100 | #189 | Fair 82.6% |
| British | 25.7 /100 | #190 | Fair 82.6% |
| Armenians | 23.2 /100 | #191 | Fair 82.5% |
| Immigrants | Iraq | 20.9 /100 | #192 | Fair 82.5% |
| Australians | 20.8 /100 | #193 | Fair 82.5% |
| Immigrants | Norway | 20.7 /100 | #194 | Fair 82.5% |
| Immigrants | Canada | 20.0 /100 | #195 | Fair 82.5% |
| Immigrants | North America | 18.8 /100 | #196 | Poor 82.5% |
| Lebanese | 18.2 /100 | #197 | Poor 82.5% |