Macedonian vs British In Labor Force | Age 45-54
COMPARE
Macedonian
British
In Labor Force | Age 45-54
In Labor Force | Age 45-54 Comparison
Macedonians
British
83.5%
IN LABOR FORCE | AGE 45-54
98.7/ 100
METRIC RATING
55th/ 347
METRIC RANK
82.6%
IN LABOR FORCE | AGE 45-54
25.7/ 100
METRIC RATING
190th/ 347
METRIC RANK
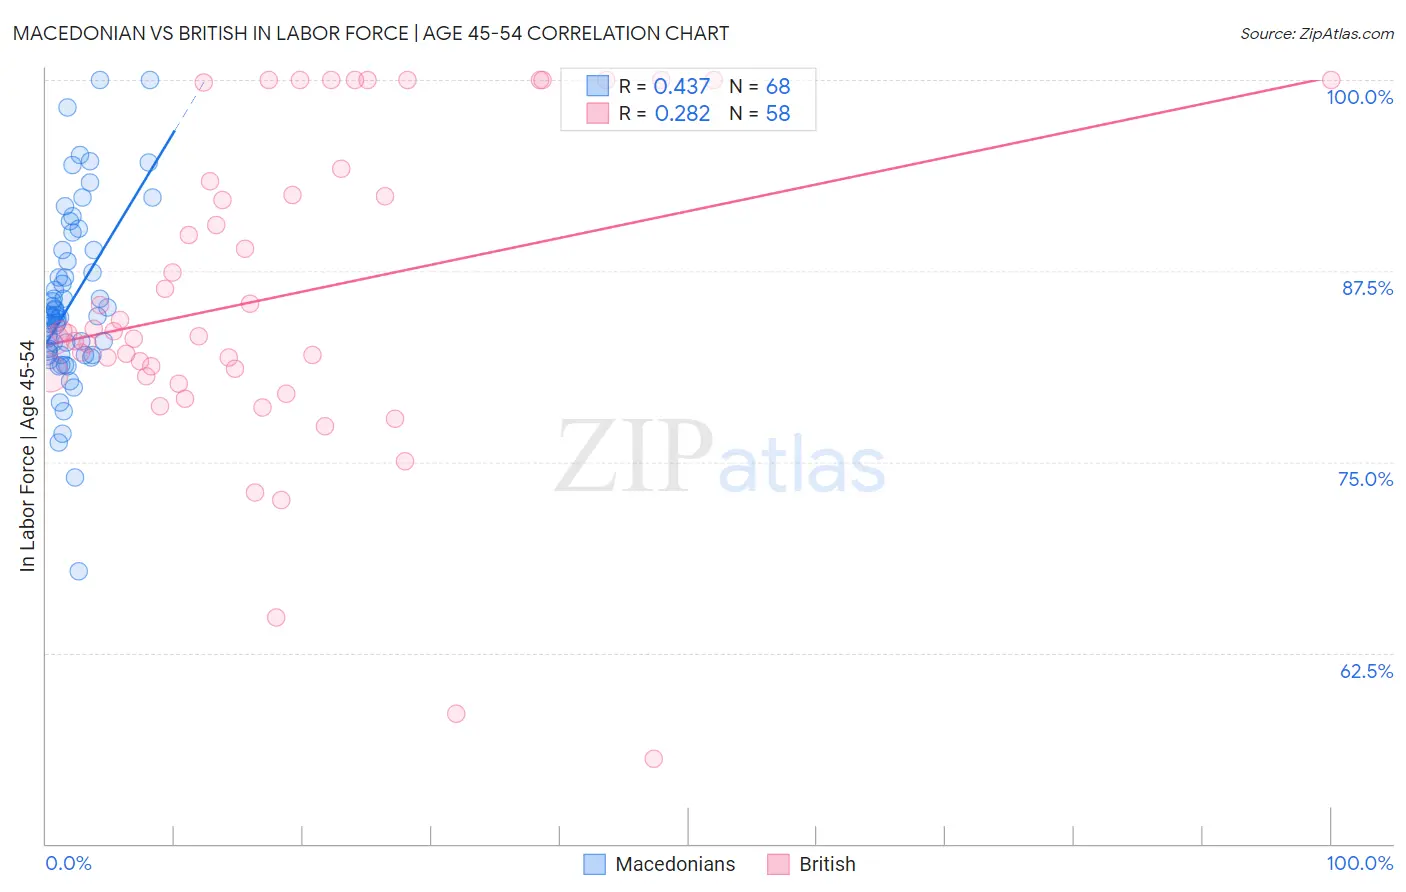
Macedonian vs British In Labor Force | Age 45-54 Correlation Chart
The statistical analysis conducted on geographies consisting of 132,596,520 people shows a moderate positive correlation between the proportion of Macedonians and labor force participation rate among population between the ages 45 and 54 in the United States with a correlation coefficient (R) of 0.437 and weighted average of 83.5%. Similarly, the statistical analysis conducted on geographies consisting of 530,949,896 people shows a weak positive correlation between the proportion of British and labor force participation rate among population between the ages 45 and 54 in the United States with a correlation coefficient (R) of 0.282 and weighted average of 82.6%, a difference of 1.2%.
In Labor Force | Age 45-54 Correlation Summary
| Measurement | Macedonian | British |
| Minimum | 67.8% | 55.6% |
| Maximum | 100.0% | 100.0% |
| Range | 32.2% | 44.4% |
| Mean | 85.5% | 85.8% |
| Median | 84.5% | 83.5% |
| Interquartile 25% (IQ1) | 82.1% | 80.8% |
| Interquartile 75% (IQ3) | 88.5% | 93.4% |
| Interquartile Range (IQR) | 6.4% | 12.6% |
| Standard Deviation (Sample) | 5.8% | 10.3% |
| Standard Deviation (Population) | 5.7% | 10.2% |
Similar Demographics by In Labor Force | Age 45-54
Demographics Similar to Macedonians by In Labor Force | Age 45-54
In terms of in labor force | age 45-54, the demographic groups most similar to Macedonians are Somali (83.5%, a difference of 0.010%), Immigrants from Greece (83.6%, a difference of 0.020%), Immigrants from Turkey (83.6%, a difference of 0.020%), Polish (83.6%, a difference of 0.020%), and Peruvian (83.6%, a difference of 0.020%).
| Demographics | Rating | Rank | In Labor Force | Age 45-54 |
| Immigrants | Poland | 99.0 /100 | #48 | Exceptional 83.6% |
| Immigrants | Morocco | 99.0 /100 | #49 | Exceptional 83.6% |
| Immigrants | Greece | 98.8 /100 | #50 | Exceptional 83.6% |
| Immigrants | Turkey | 98.8 /100 | #51 | Exceptional 83.6% |
| Poles | 98.7 /100 | #52 | Exceptional 83.6% |
| Peruvians | 98.7 /100 | #53 | Exceptional 83.6% |
| Somalis | 98.7 /100 | #54 | Exceptional 83.5% |
| Macedonians | 98.7 /100 | #55 | Exceptional 83.5% |
| Immigrants | Peru | 98.6 /100 | #56 | Exceptional 83.5% |
| Paraguayans | 98.5 /100 | #57 | Exceptional 83.5% |
| Eastern Europeans | 98.5 /100 | #58 | Exceptional 83.5% |
| Bhutanese | 98.3 /100 | #59 | Exceptional 83.5% |
| Carpatho Rusyns | 98.3 /100 | #60 | Exceptional 83.5% |
| Filipinos | 98.3 /100 | #61 | Exceptional 83.5% |
| Immigrants | Taiwan | 98.0 /100 | #62 | Exceptional 83.5% |
Demographics Similar to British by In Labor Force | Age 45-54
In terms of in labor force | age 45-54, the demographic groups most similar to British are Syrian (82.6%, a difference of 0.0%), Immigrants from Costa Rica (82.6%, a difference of 0.030%), South African (82.6%, a difference of 0.030%), Armenian (82.5%, a difference of 0.030%), and Irish (82.6%, a difference of 0.040%).
| Demographics | Rating | Rank | In Labor Force | Age 45-54 |
| New Zealanders | 32.7 /100 | #183 | Fair 82.6% |
| Europeans | 32.6 /100 | #184 | Fair 82.6% |
| Immigrants | England | 32.2 /100 | #185 | Fair 82.6% |
| Irish | 29.2 /100 | #186 | Fair 82.6% |
| Immigrants | Costa Rica | 28.3 /100 | #187 | Fair 82.6% |
| South Africans | 28.0 /100 | #188 | Fair 82.6% |
| Syrians | 26.0 /100 | #189 | Fair 82.6% |
| British | 25.7 /100 | #190 | Fair 82.6% |
| Armenians | 23.2 /100 | #191 | Fair 82.5% |
| Immigrants | Iraq | 20.9 /100 | #192 | Fair 82.5% |
| Australians | 20.8 /100 | #193 | Fair 82.5% |
| Immigrants | Norway | 20.7 /100 | #194 | Fair 82.5% |
| Immigrants | Canada | 20.0 /100 | #195 | Fair 82.5% |
| Immigrants | North America | 18.8 /100 | #196 | Poor 82.5% |
| Lebanese | 18.2 /100 | #197 | Poor 82.5% |