Immigrants from Austria vs Guyanese In Labor Force | Age 35-44
COMPARE
Immigrants from Austria
Guyanese
In Labor Force | Age 35-44
In Labor Force | Age 35-44 Comparison
Immigrants from Austria
Guyanese
84.4%
IN LABOR FORCE | AGE 35-44
63.8/ 100
METRIC RATING
157th/ 347
METRIC RANK
83.8%
IN LABOR FORCE | AGE 35-44
1.1/ 100
METRIC RATING
244th/ 347
METRIC RANK
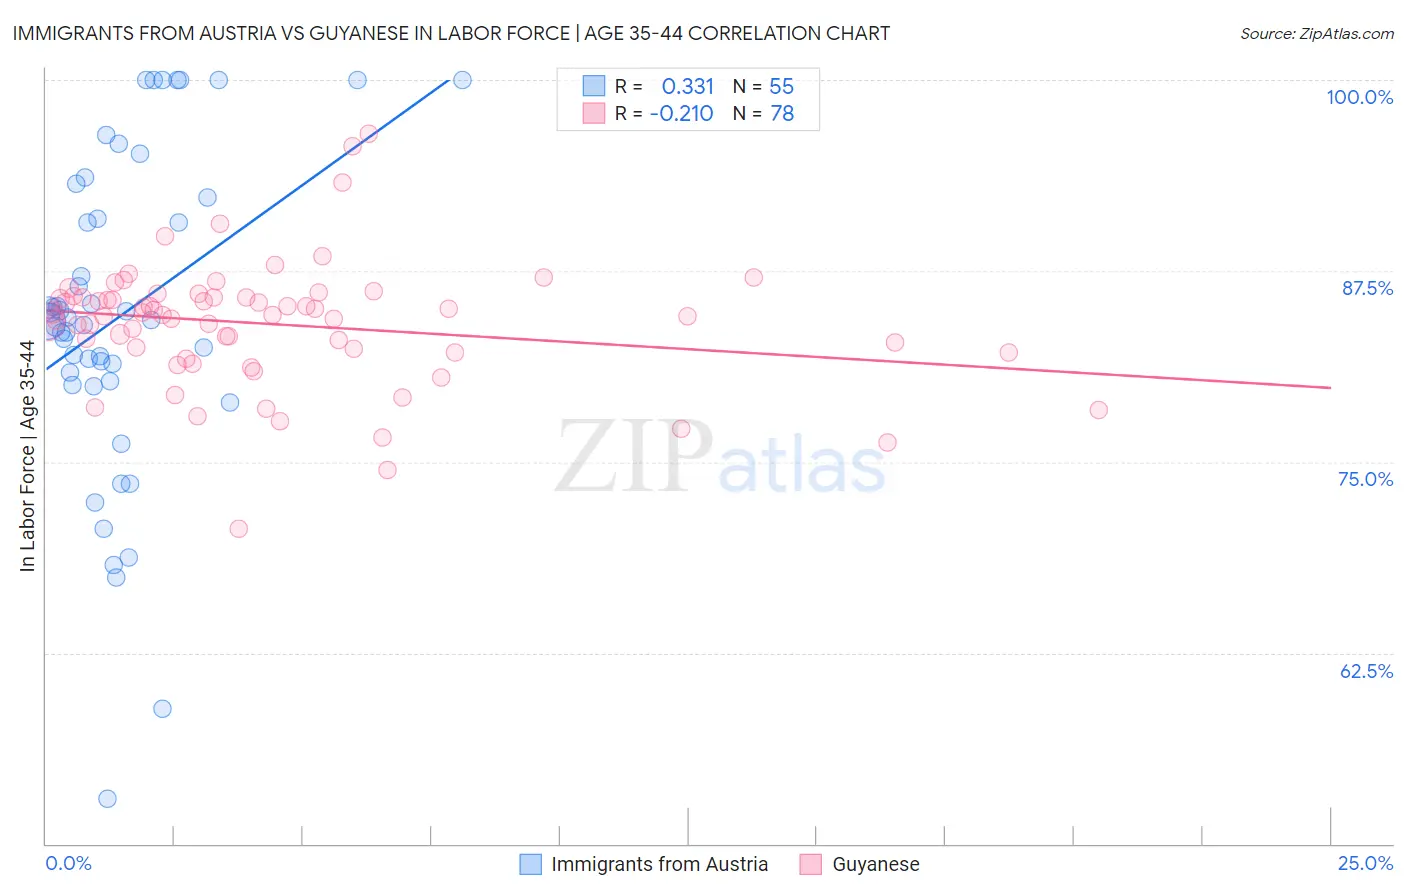
Immigrants from Austria vs Guyanese In Labor Force | Age 35-44 Correlation Chart
The statistical analysis conducted on geographies consisting of 167,953,357 people shows a mild positive correlation between the proportion of Immigrants from Austria and labor force participation rate among population between the ages 35 and 44 in the United States with a correlation coefficient (R) of 0.331 and weighted average of 84.4%. Similarly, the statistical analysis conducted on geographies consisting of 176,803,222 people shows a weak negative correlation between the proportion of Guyanese and labor force participation rate among population between the ages 35 and 44 in the United States with a correlation coefficient (R) of -0.210 and weighted average of 83.8%, a difference of 0.82%.
In Labor Force | Age 35-44 Correlation Summary
| Measurement | Immigrants from Austria | Guyanese |
| Minimum | 52.9% | 70.6% |
| Maximum | 100.0% | 96.5% |
| Range | 47.1% | 25.9% |
| Mean | 84.6% | 84.0% |
| Median | 84.3% | 84.6% |
| Interquartile 25% (IQ1) | 80.3% | 82.2% |
| Interquartile 75% (IQ3) | 92.3% | 85.8% |
| Interquartile Range (IQR) | 12.0% | 3.6% |
| Standard Deviation (Sample) | 10.5% | 4.1% |
| Standard Deviation (Population) | 10.4% | 4.1% |
Similar Demographics by In Labor Force | Age 35-44
Demographics Similar to Immigrants from Austria by In Labor Force | Age 35-44
In terms of in labor force | age 35-44, the demographic groups most similar to Immigrants from Austria are Immigrants from Israel (84.4%, a difference of 0.0%), Immigrants from Switzerland (84.5%, a difference of 0.010%), Jamaican (84.4%, a difference of 0.010%), Immigrants from Senegal (84.4%, a difference of 0.020%), and Immigrants from Kazakhstan (84.4%, a difference of 0.020%).
| Demographics | Rating | Rank | In Labor Force | Age 35-44 |
| Immigrants | Nigeria | 73.3 /100 | #150 | Good 84.5% |
| Romanians | 72.1 /100 | #151 | Good 84.5% |
| Immigrants | Taiwan | 71.4 /100 | #152 | Good 84.5% |
| Trinidadians and Tobagonians | 69.5 /100 | #153 | Good 84.5% |
| Iranians | 69.4 /100 | #154 | Good 84.5% |
| Immigrants | Switzerland | 65.9 /100 | #155 | Good 84.5% |
| Immigrants | Israel | 64.3 /100 | #156 | Good 84.4% |
| Immigrants | Austria | 63.8 /100 | #157 | Good 84.4% |
| Jamaicans | 62.7 /100 | #158 | Good 84.4% |
| Immigrants | Senegal | 60.4 /100 | #159 | Good 84.4% |
| Immigrants | Kazakhstan | 60.4 /100 | #160 | Good 84.4% |
| Immigrants | Venezuela | 60.0 /100 | #161 | Good 84.4% |
| Immigrants | Hungary | 59.4 /100 | #162 | Average 84.4% |
| Aleuts | 59.1 /100 | #163 | Average 84.4% |
| Nigerians | 58.9 /100 | #164 | Average 84.4% |
Demographics Similar to Guyanese by In Labor Force | Age 35-44
In terms of in labor force | age 35-44, the demographic groups most similar to Guyanese are Immigrants from Western Asia (83.8%, a difference of 0.0%), Malaysian (83.8%, a difference of 0.0%), Immigrants from Cambodia (83.8%, a difference of 0.010%), Immigrants (83.7%, a difference of 0.010%), and Arab (83.8%, a difference of 0.030%).
| Demographics | Rating | Rank | In Labor Force | Age 35-44 |
| English | 1.8 /100 | #237 | Tragic 83.8% |
| Immigrants | Laos | 1.7 /100 | #238 | Tragic 83.8% |
| Celtics | 1.4 /100 | #239 | Tragic 83.8% |
| Arabs | 1.3 /100 | #240 | Tragic 83.8% |
| Iraqis | 1.3 /100 | #241 | Tragic 83.8% |
| Immigrants | Cambodia | 1.1 /100 | #242 | Tragic 83.8% |
| Immigrants | Western Asia | 1.1 /100 | #243 | Tragic 83.8% |
| Guyanese | 1.1 /100 | #244 | Tragic 83.8% |
| Malaysians | 1.1 /100 | #245 | Tragic 83.8% |
| Immigrants | Immigrants | 1.0 /100 | #246 | Tragic 83.7% |
| Immigrants | Armenia | 0.9 /100 | #247 | Tragic 83.7% |
| Indonesians | 0.8 /100 | #248 | Tragic 83.7% |
| Immigrants | St. Vincent and the Grenadines | 0.7 /100 | #249 | Tragic 83.7% |
| Whites/Caucasians | 0.5 /100 | #250 | Tragic 83.6% |
| Salvadorans | 0.4 /100 | #251 | Tragic 83.6% |