Cherokee vs Hawaiian In Labor Force | Age 16-19
COMPARE
Cherokee
Hawaiian
In Labor Force | Age 16-19
In Labor Force | Age 16-19 Comparison
Cherokee
Hawaiians
40.2%
IN LABOR FORCE | AGE 16-19
100.0/ 100
METRIC RATING
62nd/ 347
METRIC RANK
38.4%
IN LABOR FORCE | AGE 16-19
98.2/ 100
METRIC RATING
114th/ 347
METRIC RANK
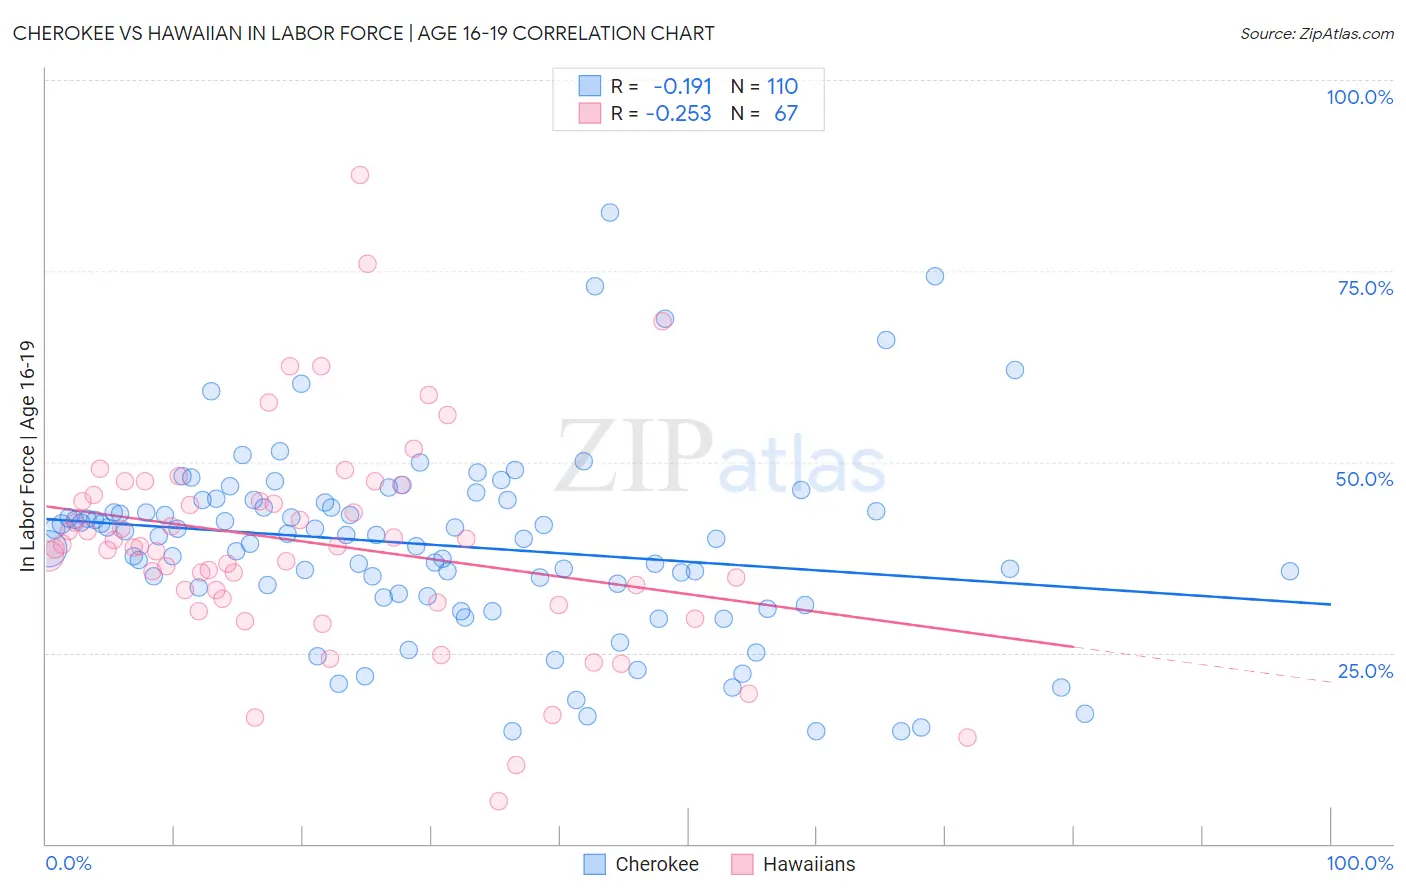
Cherokee vs Hawaiian In Labor Force | Age 16-19 Correlation Chart
The statistical analysis conducted on geographies consisting of 492,065,053 people shows a poor negative correlation between the proportion of Cherokee and labor force participation rate among population between the ages 16 and 19 in the United States with a correlation coefficient (R) of -0.191 and weighted average of 40.2%. Similarly, the statistical analysis conducted on geographies consisting of 327,147,423 people shows a weak negative correlation between the proportion of Hawaiians and labor force participation rate among population between the ages 16 and 19 in the United States with a correlation coefficient (R) of -0.253 and weighted average of 38.4%, a difference of 4.8%.
In Labor Force | Age 16-19 Correlation Summary
| Measurement | Cherokee | Hawaiian |
| Minimum | 14.7% | 5.6% |
| Maximum | 82.7% | 87.5% |
| Range | 68.0% | 81.9% |
| Mean | 39.1% | 39.4% |
| Median | 40.3% | 38.9% |
| Interquartile 25% (IQ1) | 32.8% | 32.1% |
| Interquartile 75% (IQ3) | 44.6% | 45.6% |
| Interquartile Range (IQR) | 11.9% | 13.5% |
| Standard Deviation (Sample) | 12.3% | 14.1% |
| Standard Deviation (Population) | 12.3% | 14.0% |
Similar Demographics by In Labor Force | Age 16-19
Demographics Similar to Cherokee by In Labor Force | Age 16-19
In terms of in labor force | age 16-19, the demographic groups most similar to Cherokee are Northern European (40.2%, a difference of 0.060%), American (40.3%, a difference of 0.14%), Immigrants from Micronesia (40.2%, a difference of 0.17%), Kenyan (40.1%, a difference of 0.25%), and Immigrants from Eastern Africa (40.4%, a difference of 0.29%).
| Demographics | Rating | Rank | In Labor Force | Age 16-19 |
| British | 100.0 /100 | #55 | Exceptional 40.5% |
| Fijians | 100.0 /100 | #56 | Exceptional 40.4% |
| Lithuanians | 100.0 /100 | #57 | Exceptional 40.4% |
| Aleuts | 100.0 /100 | #58 | Exceptional 40.4% |
| Slavs | 100.0 /100 | #59 | Exceptional 40.4% |
| Immigrants | Eastern Africa | 100.0 /100 | #60 | Exceptional 40.4% |
| Americans | 100.0 /100 | #61 | Exceptional 40.3% |
| Cherokee | 100.0 /100 | #62 | Exceptional 40.2% |
| Northern Europeans | 100.0 /100 | #63 | Exceptional 40.2% |
| Immigrants | Micronesia | 100.0 /100 | #64 | Exceptional 40.2% |
| Kenyans | 100.0 /100 | #65 | Exceptional 40.1% |
| Immigrants | Nonimmigrants | 100.0 /100 | #66 | Exceptional 40.1% |
| Canadians | 100.0 /100 | #67 | Exceptional 40.1% |
| Italians | 99.9 /100 | #68 | Exceptional 40.1% |
| Potawatomi | 99.9 /100 | #69 | Exceptional 40.0% |
Demographics Similar to Hawaiians by In Labor Force | Age 16-19
In terms of in labor force | age 16-19, the demographic groups most similar to Hawaiians are Subsaharan African (38.4%, a difference of 0.10%), Bulgarian (38.3%, a difference of 0.15%), Colville (38.3%, a difference of 0.15%), Chickasaw (38.3%, a difference of 0.20%), and Immigrants from Nepal (38.3%, a difference of 0.21%).
| Demographics | Rating | Rank | In Labor Force | Age 16-19 |
| Chinese | 98.8 /100 | #107 | Exceptional 38.6% |
| Immigrants | Ethiopia | 98.7 /100 | #108 | Exceptional 38.6% |
| Lebanese | 98.7 /100 | #109 | Exceptional 38.6% |
| Maltese | 98.6 /100 | #110 | Exceptional 38.5% |
| Crow | 98.5 /100 | #111 | Exceptional 38.5% |
| Immigrants | Scotland | 98.5 /100 | #112 | Exceptional 38.5% |
| Sub-Saharan Africans | 98.3 /100 | #113 | Exceptional 38.4% |
| Hawaiians | 98.2 /100 | #114 | Exceptional 38.4% |
| Bulgarians | 97.9 /100 | #115 | Exceptional 38.3% |
| Colville | 97.9 /100 | #116 | Exceptional 38.3% |
| Chickasaw | 97.8 /100 | #117 | Exceptional 38.3% |
| Immigrants | Nepal | 97.8 /100 | #118 | Exceptional 38.3% |
| Assyrians/Chaldeans/Syriacs | 97.8 /100 | #119 | Exceptional 38.3% |
| Ukrainians | 97.6 /100 | #120 | Exceptional 38.3% |
| Ethiopians | 97.4 /100 | #121 | Exceptional 38.2% |