Immigrants from Belgium vs Hawaiian In Labor Force | Age 16-19
COMPARE
Immigrants from Belgium
Hawaiian
In Labor Force | Age 16-19
In Labor Force | Age 16-19 Comparison
Immigrants from Belgium
Hawaiians
35.3%
IN LABOR FORCE | AGE 16-19
6.1/ 100
METRIC RATING
225th/ 347
METRIC RANK
38.4%
IN LABOR FORCE | AGE 16-19
98.2/ 100
METRIC RATING
114th/ 347
METRIC RANK
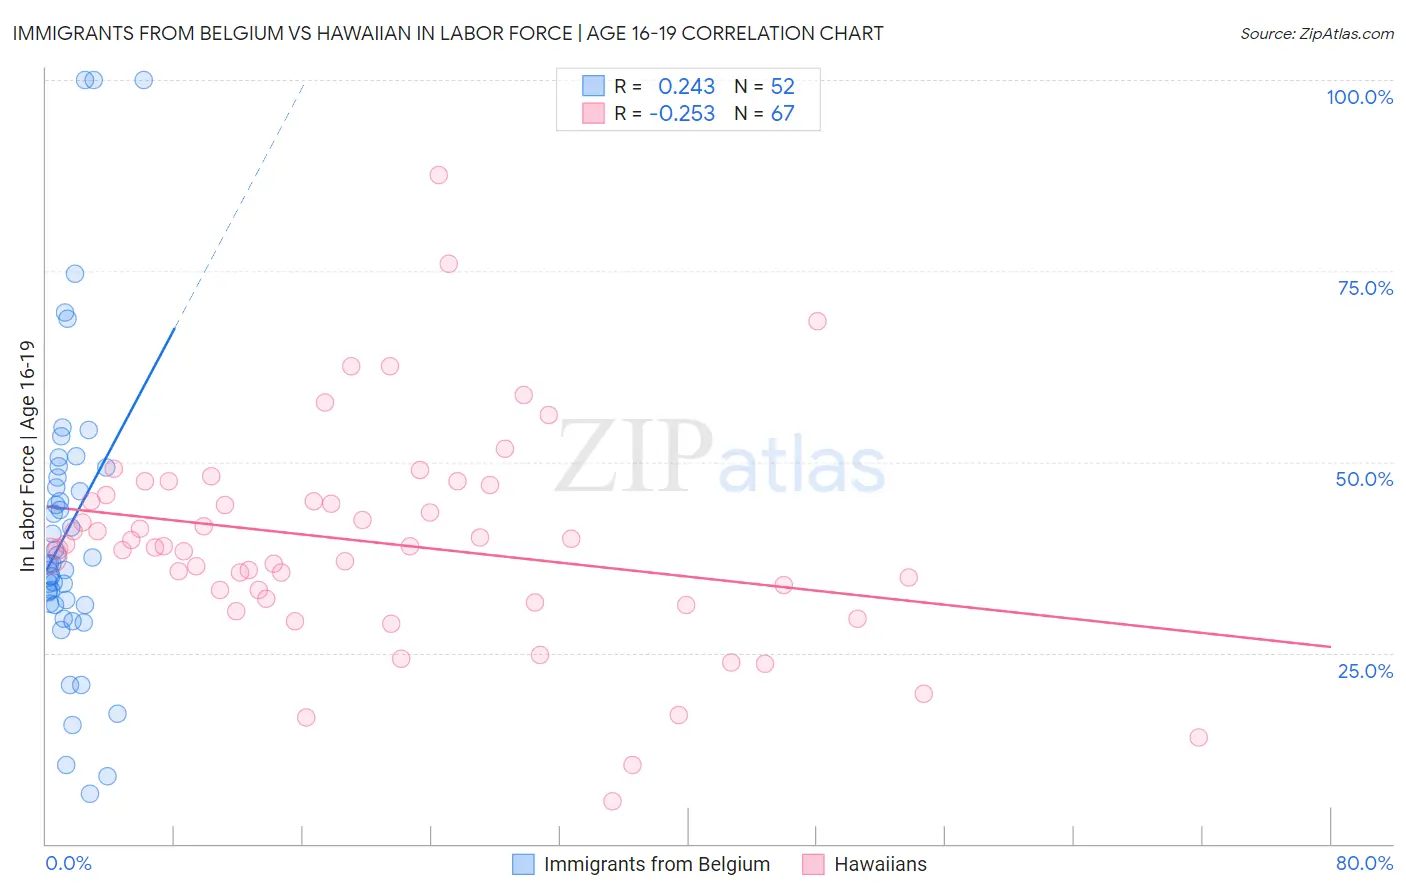
Immigrants from Belgium vs Hawaiian In Labor Force | Age 16-19 Correlation Chart
The statistical analysis conducted on geographies consisting of 146,618,217 people shows a weak positive correlation between the proportion of Immigrants from Belgium and labor force participation rate among population between the ages 16 and 19 in the United States with a correlation coefficient (R) of 0.243 and weighted average of 35.3%. Similarly, the statistical analysis conducted on geographies consisting of 327,147,423 people shows a weak negative correlation between the proportion of Hawaiians and labor force participation rate among population between the ages 16 and 19 in the United States with a correlation coefficient (R) of -0.253 and weighted average of 38.4%, a difference of 8.7%.
In Labor Force | Age 16-19 Correlation Summary
| Measurement | Immigrants from Belgium | Hawaiian |
| Minimum | 6.6% | 5.6% |
| Maximum | 100.0% | 87.5% |
| Range | 93.4% | 81.9% |
| Mean | 41.3% | 39.4% |
| Median | 36.7% | 38.9% |
| Interquartile 25% (IQ1) | 31.4% | 32.1% |
| Interquartile 75% (IQ3) | 48.6% | 45.6% |
| Interquartile Range (IQR) | 17.2% | 13.5% |
| Standard Deviation (Sample) | 20.2% | 14.1% |
| Standard Deviation (Population) | 20.0% | 14.0% |
Similar Demographics by In Labor Force | Age 16-19
Demographics Similar to Immigrants from Belgium by In Labor Force | Age 16-19
In terms of in labor force | age 16-19, the demographic groups most similar to Immigrants from Belgium are Honduran (35.3%, a difference of 0.080%), Ghanaian (35.3%, a difference of 0.090%), Immigrants from Guatemala (35.3%, a difference of 0.090%), Mongolian (35.3%, a difference of 0.10%), and Immigrants from Senegal (35.3%, a difference of 0.15%).
| Demographics | Rating | Rank | In Labor Force | Age 16-19 |
| Sri Lankans | 9.8 /100 | #218 | Tragic 35.5% |
| Guatemalans | 8.6 /100 | #219 | Tragic 35.5% |
| Immigrants | Bahamas | 8.3 /100 | #220 | Tragic 35.5% |
| Turks | 7.3 /100 | #221 | Tragic 35.4% |
| Immigrants | Ghana | 7.3 /100 | #222 | Tragic 35.4% |
| Ghanaians | 6.5 /100 | #223 | Tragic 35.3% |
| Hondurans | 6.5 /100 | #224 | Tragic 35.3% |
| Immigrants | Belgium | 6.1 /100 | #225 | Tragic 35.3% |
| Immigrants | Guatemala | 5.7 /100 | #226 | Tragic 35.3% |
| Mongolians | 5.7 /100 | #227 | Tragic 35.3% |
| Immigrants | Senegal | 5.5 /100 | #228 | Tragic 35.3% |
| Immigrants | Lebanon | 5.0 /100 | #229 | Tragic 35.2% |
| Immigrants | Honduras | 4.9 /100 | #230 | Tragic 35.2% |
| Immigrants | Syria | 4.5 /100 | #231 | Tragic 35.2% |
| Immigrants | Kazakhstan | 4.5 /100 | #232 | Tragic 35.2% |
Demographics Similar to Hawaiians by In Labor Force | Age 16-19
In terms of in labor force | age 16-19, the demographic groups most similar to Hawaiians are Subsaharan African (38.4%, a difference of 0.10%), Bulgarian (38.3%, a difference of 0.15%), Colville (38.3%, a difference of 0.15%), Chickasaw (38.3%, a difference of 0.20%), and Immigrants from Nepal (38.3%, a difference of 0.21%).
| Demographics | Rating | Rank | In Labor Force | Age 16-19 |
| Chinese | 98.8 /100 | #107 | Exceptional 38.6% |
| Immigrants | Ethiopia | 98.7 /100 | #108 | Exceptional 38.6% |
| Lebanese | 98.7 /100 | #109 | Exceptional 38.6% |
| Maltese | 98.6 /100 | #110 | Exceptional 38.5% |
| Crow | 98.5 /100 | #111 | Exceptional 38.5% |
| Immigrants | Scotland | 98.5 /100 | #112 | Exceptional 38.5% |
| Sub-Saharan Africans | 98.3 /100 | #113 | Exceptional 38.4% |
| Hawaiians | 98.2 /100 | #114 | Exceptional 38.4% |
| Bulgarians | 97.9 /100 | #115 | Exceptional 38.3% |
| Colville | 97.9 /100 | #116 | Exceptional 38.3% |
| Chickasaw | 97.8 /100 | #117 | Exceptional 38.3% |
| Immigrants | Nepal | 97.8 /100 | #118 | Exceptional 38.3% |
| Assyrians/Chaldeans/Syriacs | 97.8 /100 | #119 | Exceptional 38.3% |
| Ukrainians | 97.6 /100 | #120 | Exceptional 38.3% |
| Ethiopians | 97.4 /100 | #121 | Exceptional 38.2% |