Moroccan vs Hawaiian In Labor Force | Age 16-19
COMPARE
Moroccan
Hawaiian
In Labor Force | Age 16-19
In Labor Force | Age 16-19 Comparison
Moroccans
Hawaiians
35.7%
IN LABOR FORCE | AGE 16-19
12.7/ 100
METRIC RATING
209th/ 347
METRIC RANK
38.4%
IN LABOR FORCE | AGE 16-19
98.2/ 100
METRIC RATING
114th/ 347
METRIC RANK
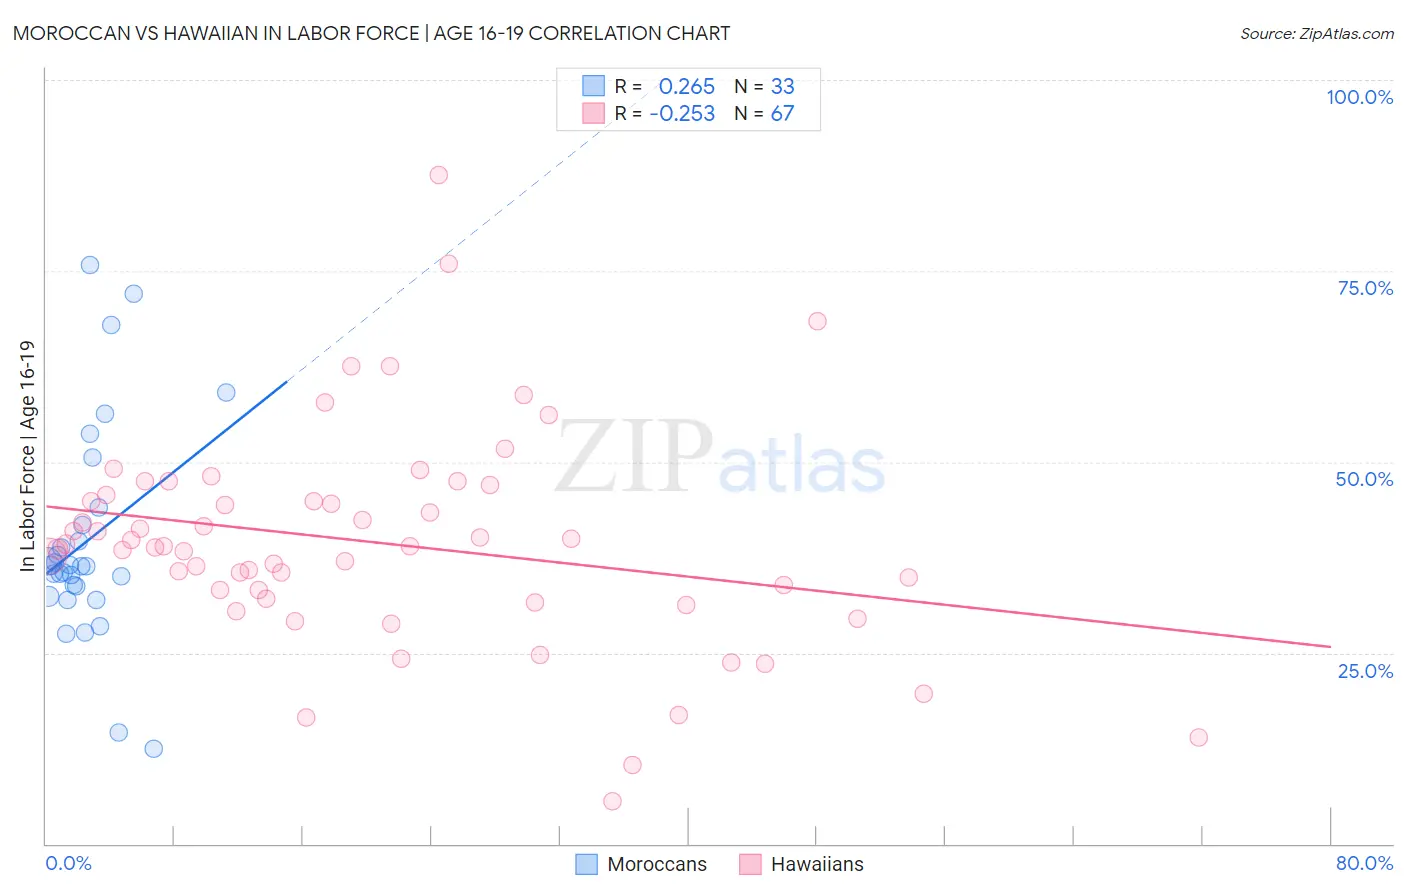
Moroccan vs Hawaiian In Labor Force | Age 16-19 Correlation Chart
The statistical analysis conducted on geographies consisting of 201,678,559 people shows a weak positive correlation between the proportion of Moroccans and labor force participation rate among population between the ages 16 and 19 in the United States with a correlation coefficient (R) of 0.265 and weighted average of 35.7%. Similarly, the statistical analysis conducted on geographies consisting of 327,147,423 people shows a weak negative correlation between the proportion of Hawaiians and labor force participation rate among population between the ages 16 and 19 in the United States with a correlation coefficient (R) of -0.253 and weighted average of 38.4%, a difference of 7.6%.
In Labor Force | Age 16-19 Correlation Summary
| Measurement | Moroccan | Hawaiian |
| Minimum | 12.5% | 5.6% |
| Maximum | 75.8% | 87.5% |
| Range | 63.3% | 81.9% |
| Mean | 39.6% | 39.4% |
| Median | 36.4% | 38.9% |
| Interquartile 25% (IQ1) | 33.0% | 32.1% |
| Interquartile 75% (IQ3) | 42.9% | 45.6% |
| Interquartile Range (IQR) | 9.9% | 13.5% |
| Standard Deviation (Sample) | 14.1% | 14.1% |
| Standard Deviation (Population) | 13.8% | 14.0% |
Similar Demographics by In Labor Force | Age 16-19
Demographics Similar to Moroccans by In Labor Force | Age 16-19
In terms of in labor force | age 16-19, the demographic groups most similar to Moroccans are Korean (35.7%, a difference of 0.070%), Immigrants from Switzerland (35.6%, a difference of 0.10%), Mexican (35.6%, a difference of 0.10%), Immigrants from Eastern Europe (35.8%, a difference of 0.19%), and South American Indian (35.8%, a difference of 0.21%).
| Demographics | Rating | Rank | In Labor Force | Age 16-19 |
| Senegalese | 17.4 /100 | #202 | Poor 35.9% |
| Immigrants | Nigeria | 16.8 /100 | #203 | Poor 35.8% |
| Immigrants | Albania | 15.0 /100 | #204 | Poor 35.8% |
| South American Indians | 14.6 /100 | #205 | Poor 35.8% |
| Chileans | 14.6 /100 | #206 | Poor 35.8% |
| Immigrants | Eastern Europe | 14.5 /100 | #207 | Poor 35.8% |
| Koreans | 13.3 /100 | #208 | Poor 35.7% |
| Moroccans | 12.7 /100 | #209 | Poor 35.7% |
| Immigrants | Switzerland | 11.9 /100 | #210 | Poor 35.6% |
| Mexicans | 11.9 /100 | #211 | Poor 35.6% |
| Houma | 11.0 /100 | #212 | Poor 35.6% |
| Immigrants | Bolivia | 11.0 /100 | #213 | Poor 35.6% |
| Apache | 11.0 /100 | #214 | Poor 35.6% |
| Immigrants | South Eastern Asia | 10.8 /100 | #215 | Poor 35.6% |
| Dutch West Indians | 10.7 /100 | #216 | Poor 35.6% |
Demographics Similar to Hawaiians by In Labor Force | Age 16-19
In terms of in labor force | age 16-19, the demographic groups most similar to Hawaiians are Subsaharan African (38.4%, a difference of 0.10%), Bulgarian (38.3%, a difference of 0.15%), Colville (38.3%, a difference of 0.15%), Chickasaw (38.3%, a difference of 0.20%), and Immigrants from Nepal (38.3%, a difference of 0.21%).
| Demographics | Rating | Rank | In Labor Force | Age 16-19 |
| Chinese | 98.8 /100 | #107 | Exceptional 38.6% |
| Immigrants | Ethiopia | 98.7 /100 | #108 | Exceptional 38.6% |
| Lebanese | 98.7 /100 | #109 | Exceptional 38.6% |
| Maltese | 98.6 /100 | #110 | Exceptional 38.5% |
| Crow | 98.5 /100 | #111 | Exceptional 38.5% |
| Immigrants | Scotland | 98.5 /100 | #112 | Exceptional 38.5% |
| Sub-Saharan Africans | 98.3 /100 | #113 | Exceptional 38.4% |
| Hawaiians | 98.2 /100 | #114 | Exceptional 38.4% |
| Bulgarians | 97.9 /100 | #115 | Exceptional 38.3% |
| Colville | 97.9 /100 | #116 | Exceptional 38.3% |
| Chickasaw | 97.8 /100 | #117 | Exceptional 38.3% |
| Immigrants | Nepal | 97.8 /100 | #118 | Exceptional 38.3% |
| Assyrians/Chaldeans/Syriacs | 97.8 /100 | #119 | Exceptional 38.3% |
| Ukrainians | 97.6 /100 | #120 | Exceptional 38.3% |
| Ethiopians | 97.4 /100 | #121 | Exceptional 38.2% |