Cherokee vs Hawaiian 12th Grade, No Diploma
COMPARE
Cherokee
Hawaiian
12th Grade, No Diploma
12th Grade, No Diploma Comparison
Cherokee
Hawaiians
90.5%
12TH GRADE, NO DIPLOMA
7.4/ 100
METRIC RATING
217th/ 347
METRIC RANK
90.8%
12TH GRADE, NO DIPLOMA
19.7/ 100
METRIC RATING
201st/ 347
METRIC RANK
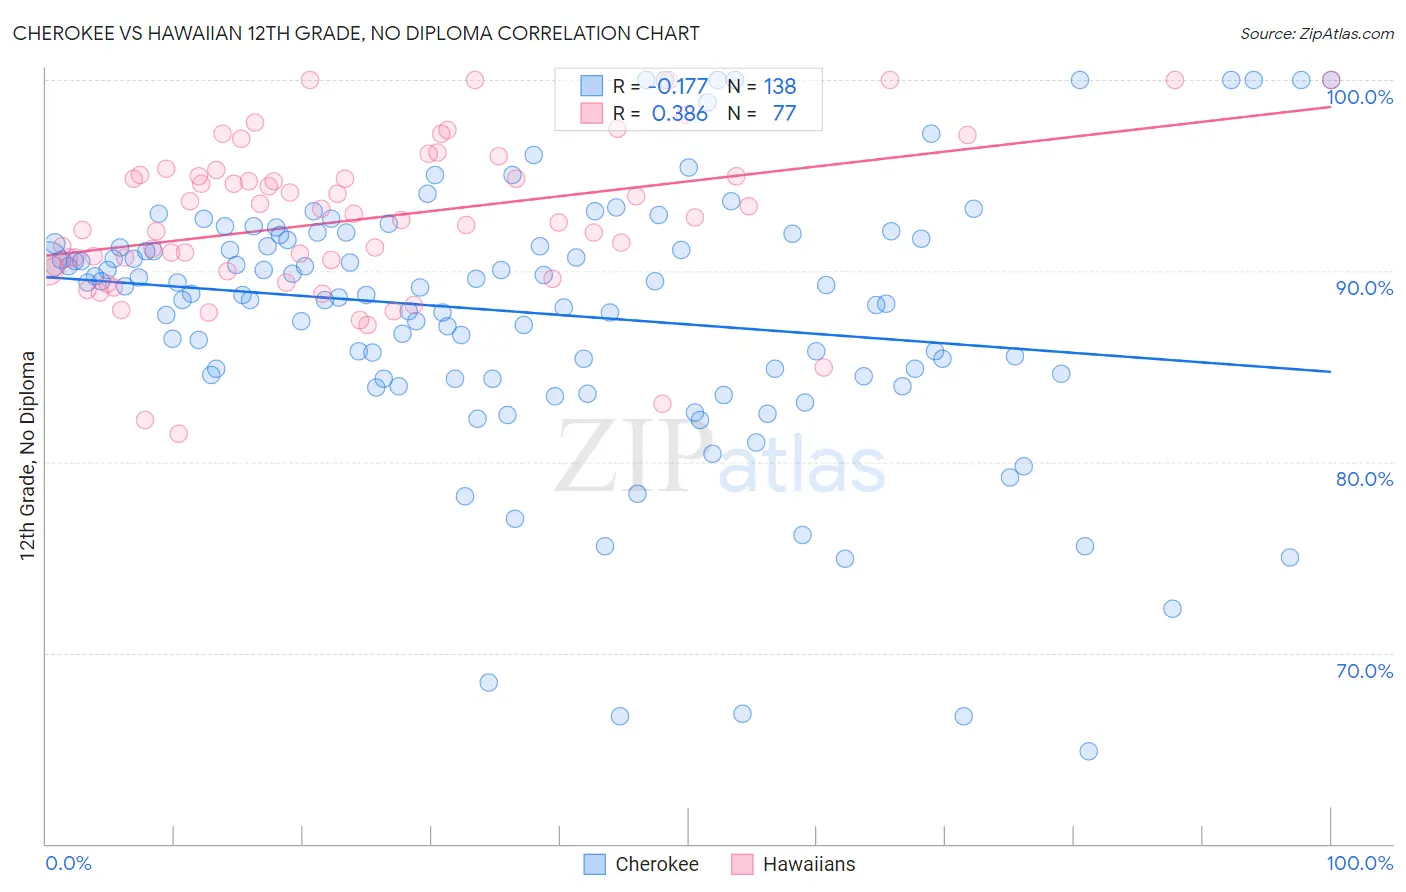
Cherokee vs Hawaiian 12th Grade, No Diploma Correlation Chart
The statistical analysis conducted on geographies consisting of 493,720,047 people shows a poor negative correlation between the proportion of Cherokee and percentage of population with at least 12th grade (no diploma) education in the United States with a correlation coefficient (R) of -0.177 and weighted average of 90.5%. Similarly, the statistical analysis conducted on geographies consisting of 327,621,279 people shows a mild positive correlation between the proportion of Hawaiians and percentage of population with at least 12th grade (no diploma) education in the United States with a correlation coefficient (R) of 0.386 and weighted average of 90.8%, a difference of 0.35%.
12th Grade, No Diploma Correlation Summary
| Measurement | Cherokee | Hawaiian |
| Minimum | 64.9% | 81.5% |
| Maximum | 100.0% | 100.0% |
| Range | 35.1% | 18.5% |
| Mean | 87.8% | 92.7% |
| Median | 89.2% | 92.8% |
| Interquartile 25% (IQ1) | 84.5% | 90.1% |
| Interquartile 75% (IQ3) | 91.7% | 95.2% |
| Interquartile Range (IQR) | 7.1% | 5.0% |
| Standard Deviation (Sample) | 7.0% | 4.1% |
| Standard Deviation (Population) | 7.0% | 4.1% |
Demographics Similar to Cherokee and Hawaiians by 12th Grade, No Diploma
In terms of 12th grade, no diploma, the demographic groups most similar to Cherokee are Shoshone (90.5%, a difference of 0.0%), Immigrants from Cameroon (90.5%, a difference of 0.0%), Arapaho (90.5%, a difference of 0.010%), Uruguayan (90.4%, a difference of 0.020%), and Immigrants from Africa (90.5%, a difference of 0.040%). Similarly, the demographic groups most similar to Hawaiians are Immigrants from Southern Europe (90.8%, a difference of 0.0%), Liberian (90.8%, a difference of 0.0%), Marshallese (90.7%, a difference of 0.030%), Tongan (90.7%, a difference of 0.080%), and French American Indian (90.7%, a difference of 0.090%).
| Demographics | Rating | Rank | 12th Grade, No Diploma |
| Immigrants | Southern Europe | 19.9 /100 | #199 | Poor 90.8% |
| Liberians | 19.8 /100 | #200 | Poor 90.8% |
| Hawaiians | 19.7 /100 | #201 | Poor 90.8% |
| Marshallese | 18.2 /100 | #202 | Poor 90.7% |
| Tongans | 16.1 /100 | #203 | Poor 90.7% |
| French American Indians | 15.5 /100 | #204 | Poor 90.7% |
| Immigrants | Sierra Leone | 14.9 /100 | #205 | Poor 90.7% |
| Immigrants | Bolivia | 12.3 /100 | #206 | Poor 90.6% |
| Armenians | 11.6 /100 | #207 | Poor 90.6% |
| Immigrants | Micronesia | 11.0 /100 | #208 | Poor 90.6% |
| Immigrants | Afghanistan | 11.0 /100 | #209 | Poor 90.6% |
| South American Indians | 10.9 /100 | #210 | Poor 90.6% |
| Portuguese | 10.6 /100 | #211 | Poor 90.6% |
| Somalis | 10.2 /100 | #212 | Poor 90.6% |
| Costa Ricans | 9.4 /100 | #213 | Tragic 90.5% |
| Immigrants | Africa | 8.5 /100 | #214 | Tragic 90.5% |
| Arapaho | 7.7 /100 | #215 | Tragic 90.5% |
| Shoshone | 7.5 /100 | #216 | Tragic 90.5% |
| Cherokee | 7.4 /100 | #217 | Tragic 90.5% |
| Immigrants | Cameroon | 7.4 /100 | #218 | Tragic 90.5% |
| Uruguayans | 7.0 /100 | #219 | Tragic 90.4% |