Central American Indian vs Seminole In Labor Force | Age 35-44
COMPARE
Central American Indian
Seminole
In Labor Force | Age 35-44
In Labor Force | Age 35-44 Comparison
Central American Indians
Seminole
82.5%
IN LABOR FORCE | AGE 35-44
0.0/ 100
METRIC RATING
300th/ 347
METRIC RANK
80.4%
IN LABOR FORCE | AGE 35-44
0.0/ 100
METRIC RATING
326th/ 347
METRIC RANK
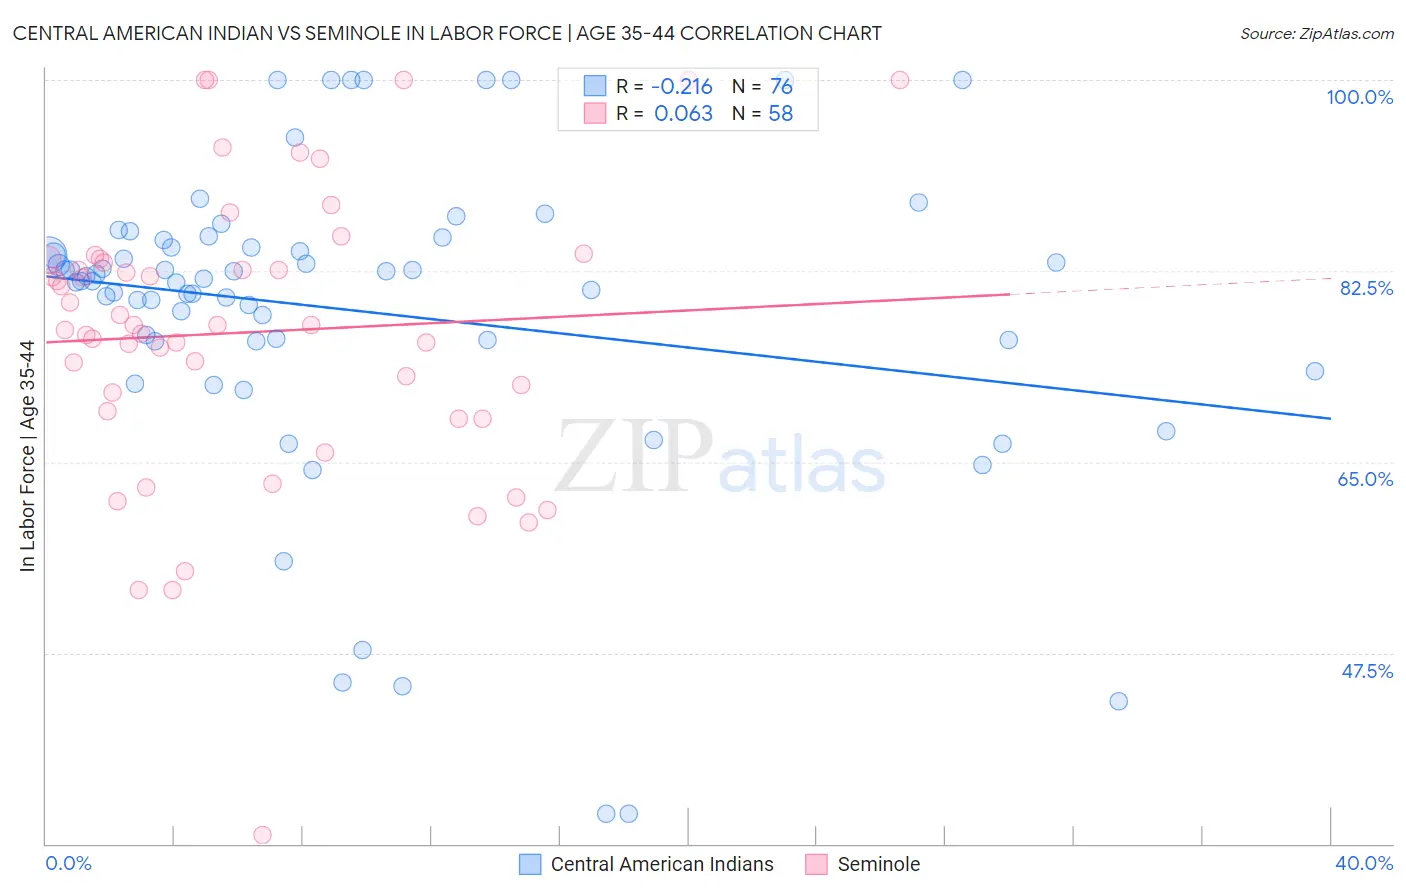
Central American Indian vs Seminole In Labor Force | Age 35-44 Correlation Chart
The statistical analysis conducted on geographies consisting of 326,103,474 people shows a weak negative correlation between the proportion of Central American Indians and labor force participation rate among population between the ages 35 and 44 in the United States with a correlation coefficient (R) of -0.216 and weighted average of 82.5%. Similarly, the statistical analysis conducted on geographies consisting of 118,299,228 people shows a slight positive correlation between the proportion of Seminole and labor force participation rate among population between the ages 35 and 44 in the United States with a correlation coefficient (R) of 0.063 and weighted average of 80.4%, a difference of 2.6%.
In Labor Force | Age 35-44 Correlation Summary
| Measurement | Central American Indian | Seminole |
| Minimum | 32.8% | 30.8% |
| Maximum | 100.0% | 100.0% |
| Range | 67.2% | 69.2% |
| Mean | 78.8% | 76.9% |
| Median | 81.7% | 77.5% |
| Interquartile 25% (IQ1) | 76.1% | 69.6% |
| Interquartile 75% (IQ3) | 85.0% | 83.5% |
| Interquartile Range (IQR) | 8.9% | 14.0% |
| Standard Deviation (Sample) | 14.3% | 13.3% |
| Standard Deviation (Population) | 14.3% | 13.2% |
Similar Demographics by In Labor Force | Age 35-44
Demographics Similar to Central American Indians by In Labor Force | Age 35-44
In terms of in labor force | age 35-44, the demographic groups most similar to Central American Indians are Spanish American Indian (82.5%, a difference of 0.020%), Tlingit-Haida (82.5%, a difference of 0.070%), Ottawa (82.6%, a difference of 0.080%), Hmong (82.6%, a difference of 0.090%), and Mexican American Indian (82.6%, a difference of 0.10%).
| Demographics | Rating | Rank | In Labor Force | Age 35-44 |
| Spanish Americans | 0.0 /100 | #293 | Tragic 82.8% |
| Potawatomi | 0.0 /100 | #294 | Tragic 82.7% |
| Immigrants | Lebanon | 0.0 /100 | #295 | Tragic 82.7% |
| Mexican American Indians | 0.0 /100 | #296 | Tragic 82.6% |
| Hmong | 0.0 /100 | #297 | Tragic 82.6% |
| Ottawa | 0.0 /100 | #298 | Tragic 82.6% |
| Tlingit-Haida | 0.0 /100 | #299 | Tragic 82.5% |
| Central American Indians | 0.0 /100 | #300 | Tragic 82.5% |
| Spanish American Indians | 0.0 /100 | #301 | Tragic 82.5% |
| Americans | 0.0 /100 | #302 | Tragic 82.4% |
| Nepalese | 0.0 /100 | #303 | Tragic 82.4% |
| Marshallese | 0.0 /100 | #304 | Tragic 82.4% |
| Shoshone | 0.0 /100 | #305 | Tragic 82.2% |
| Blacks/African Americans | 0.0 /100 | #306 | Tragic 82.2% |
| Hispanics or Latinos | 0.0 /100 | #307 | Tragic 82.1% |
Demographics Similar to Seminole by In Labor Force | Age 35-44
In terms of in labor force | age 35-44, the demographic groups most similar to Seminole are Dutch West Indian (80.4%, a difference of 0.040%), Sioux (80.2%, a difference of 0.17%), Choctaw (80.5%, a difference of 0.19%), Yaqui (80.5%, a difference of 0.20%), and Paiute (80.6%, a difference of 0.31%).
| Demographics | Rating | Rank | In Labor Force | Age 35-44 |
| Inupiat | 0.0 /100 | #319 | Tragic 80.9% |
| Chickasaw | 0.0 /100 | #320 | Tragic 80.9% |
| Puerto Ricans | 0.0 /100 | #321 | Tragic 80.7% |
| Paiute | 0.0 /100 | #322 | Tragic 80.6% |
| Yaqui | 0.0 /100 | #323 | Tragic 80.5% |
| Choctaw | 0.0 /100 | #324 | Tragic 80.5% |
| Dutch West Indians | 0.0 /100 | #325 | Tragic 80.4% |
| Seminole | 0.0 /100 | #326 | Tragic 80.4% |
| Sioux | 0.0 /100 | #327 | Tragic 80.2% |
| Creek | 0.0 /100 | #328 | Tragic 80.0% |
| Menominee | 0.0 /100 | #329 | Tragic 79.7% |
| Cheyenne | 0.0 /100 | #330 | Tragic 79.5% |
| Houma | 0.0 /100 | #331 | Tragic 79.5% |
| Ute | 0.0 /100 | #332 | Tragic 79.4% |
| Kiowa | 0.0 /100 | #333 | Tragic 79.2% |