Blackfeet vs Nicaraguan In Labor Force | Age 35-44
COMPARE
Blackfeet
Nicaraguan
In Labor Force | Age 35-44
In Labor Force | Age 35-44 Comparison
Blackfeet
Nicaraguans
81.9%
IN LABOR FORCE | AGE 35-44
0.0/ 100
METRIC RATING
310th/ 347
METRIC RANK
84.1%
IN LABOR FORCE | AGE 35-44
12.1/ 100
METRIC RATING
216th/ 347
METRIC RANK
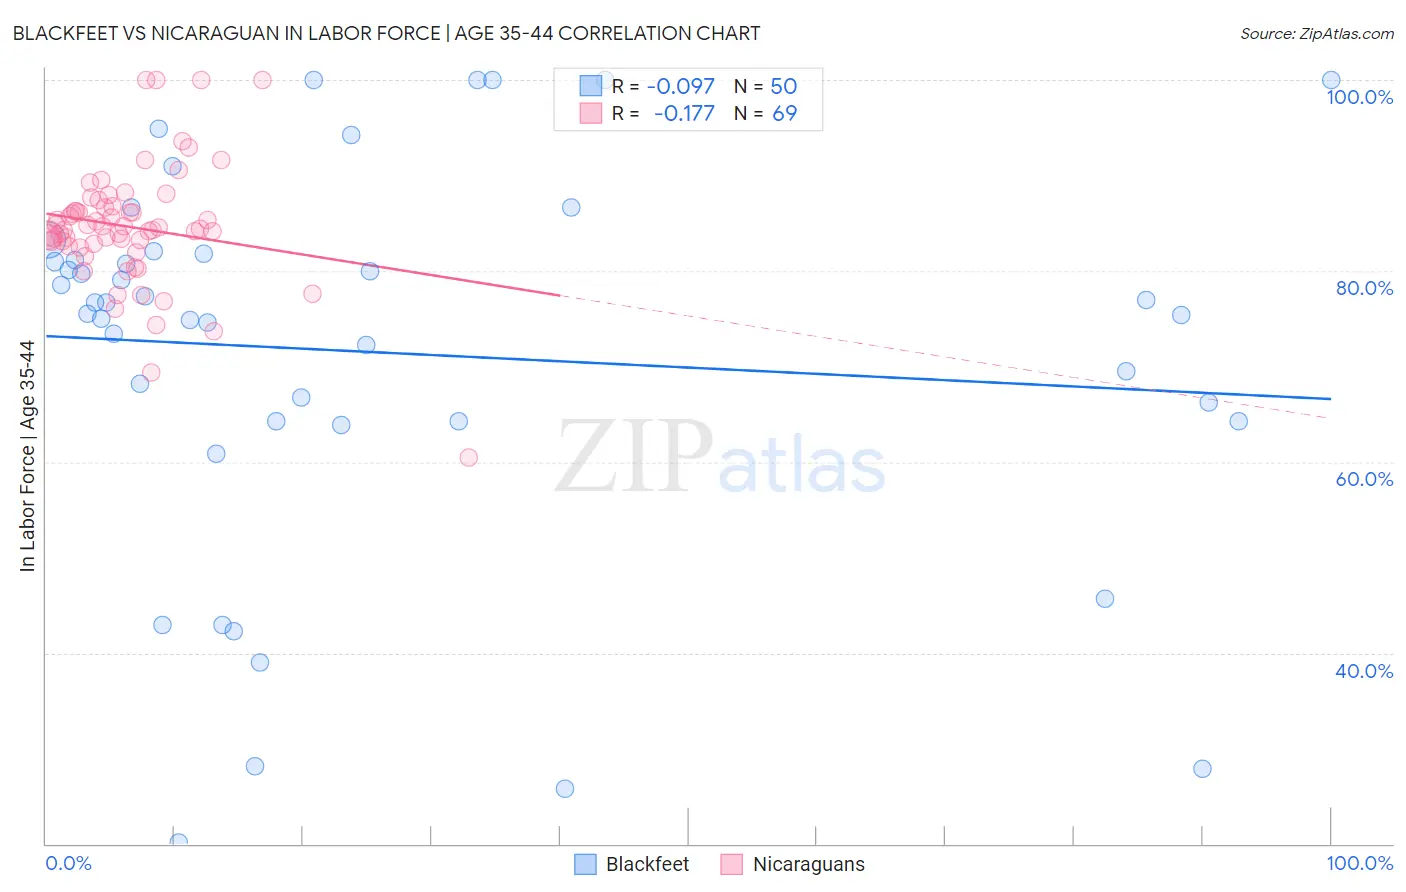
Blackfeet vs Nicaraguan In Labor Force | Age 35-44 Correlation Chart
The statistical analysis conducted on geographies consisting of 309,495,492 people shows a slight negative correlation between the proportion of Blackfeet and labor force participation rate among population between the ages 35 and 44 in the United States with a correlation coefficient (R) of -0.097 and weighted average of 81.9%. Similarly, the statistical analysis conducted on geographies consisting of 285,645,382 people shows a poor negative correlation between the proportion of Nicaraguans and labor force participation rate among population between the ages 35 and 44 in the United States with a correlation coefficient (R) of -0.177 and weighted average of 84.1%, a difference of 2.7%.
In Labor Force | Age 35-44 Correlation Summary
| Measurement | Blackfeet | Nicaraguan |
| Minimum | 20.1% | 60.4% |
| Maximum | 100.0% | 100.0% |
| Range | 79.9% | 39.6% |
| Mean | 71.4% | 84.6% |
| Median | 76.0% | 84.4% |
| Interquartile 25% (IQ1) | 64.2% | 82.7% |
| Interquartile 75% (IQ3) | 81.8% | 86.7% |
| Interquartile Range (IQR) | 17.6% | 3.9% |
| Standard Deviation (Sample) | 20.3% | 6.4% |
| Standard Deviation (Population) | 20.1% | 6.4% |
Similar Demographics by In Labor Force | Age 35-44
Demographics Similar to Blackfeet by In Labor Force | Age 35-44
In terms of in labor force | age 35-44, the demographic groups most similar to Blackfeet are Cree (82.0%, a difference of 0.12%), Immigrants from Central America (82.0%, a difference of 0.13%), Colville (81.7%, a difference of 0.17%), Hispanic or Latino (82.1%, a difference of 0.28%), and Alaska Native (81.6%, a difference of 0.32%).
| Demographics | Rating | Rank | In Labor Force | Age 35-44 |
| Nepalese | 0.0 /100 | #303 | Tragic 82.4% |
| Marshallese | 0.0 /100 | #304 | Tragic 82.4% |
| Shoshone | 0.0 /100 | #305 | Tragic 82.2% |
| Blacks/African Americans | 0.0 /100 | #306 | Tragic 82.2% |
| Hispanics or Latinos | 0.0 /100 | #307 | Tragic 82.1% |
| Immigrants | Central America | 0.0 /100 | #308 | Tragic 82.0% |
| Cree | 0.0 /100 | #309 | Tragic 82.0% |
| Blackfeet | 0.0 /100 | #310 | Tragic 81.9% |
| Colville | 0.0 /100 | #311 | Tragic 81.7% |
| Alaska Natives | 0.0 /100 | #312 | Tragic 81.6% |
| Mexicans | 0.0 /100 | #313 | Tragic 81.6% |
| Cajuns | 0.0 /100 | #314 | Tragic 81.5% |
| Immigrants | Mexico | 0.0 /100 | #315 | Tragic 81.5% |
| Comanche | 0.0 /100 | #316 | Tragic 81.5% |
| Cherokee | 0.0 /100 | #317 | Tragic 81.4% |
Demographics Similar to Nicaraguans by In Labor Force | Age 35-44
In terms of in labor force | age 35-44, the demographic groups most similar to Nicaraguans are European (84.1%, a difference of 0.0%), Immigrants from Norway (84.1%, a difference of 0.010%), Bangladeshi (84.1%, a difference of 0.020%), Immigrants from Barbados (84.1%, a difference of 0.020%), and Israeli (84.1%, a difference of 0.030%).
| Demographics | Rating | Rank | In Labor Force | Age 35-44 |
| Swiss | 17.4 /100 | #209 | Poor 84.2% |
| New Zealanders | 16.2 /100 | #210 | Poor 84.1% |
| Immigrants | Ecuador | 15.2 /100 | #211 | Poor 84.1% |
| Israelis | 14.0 /100 | #212 | Poor 84.1% |
| Bangladeshis | 13.7 /100 | #213 | Poor 84.1% |
| Immigrants | Barbados | 13.2 /100 | #214 | Poor 84.1% |
| Europeans | 12.2 /100 | #215 | Poor 84.1% |
| Nicaraguans | 12.1 /100 | #216 | Poor 84.1% |
| Immigrants | Norway | 11.7 /100 | #217 | Poor 84.1% |
| Immigrants | Nicaragua | 9.4 /100 | #218 | Tragic 84.1% |
| Sub-Saharan Africans | 9.3 /100 | #219 | Tragic 84.1% |
| French | 7.5 /100 | #220 | Tragic 84.0% |
| Icelanders | 6.7 /100 | #221 | Tragic 84.0% |
| Assyrians/Chaldeans/Syriacs | 6.6 /100 | #222 | Tragic 84.0% |
| Immigrants | Panama | 6.4 /100 | #223 | Tragic 84.0% |