Seminole vs Immigrants from Uzbekistan In Labor Force | Age 45-54
COMPARE
Seminole
Immigrants from Uzbekistan
In Labor Force | Age 45-54
In Labor Force | Age 45-54 Comparison
Seminole
Immigrants from Uzbekistan
78.1%
IN LABOR FORCE | AGE 45-54
0.0/ 100
METRIC RATING
326th/ 347
METRIC RANK
82.3%
IN LABOR FORCE | AGE 45-54
5.8/ 100
METRIC RATING
213th/ 347
METRIC RANK
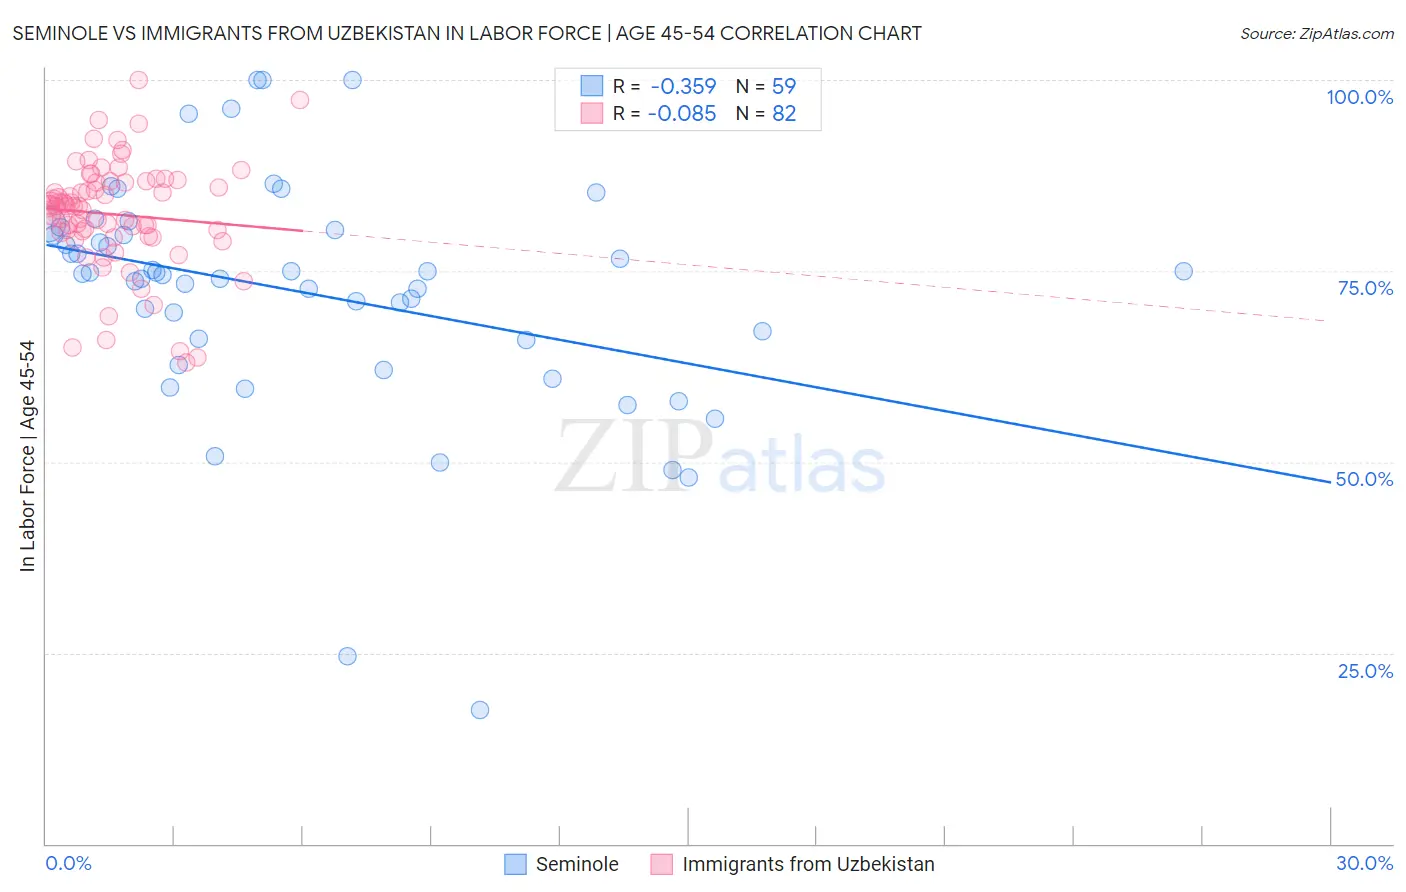
Seminole vs Immigrants from Uzbekistan In Labor Force | Age 45-54 Correlation Chart
The statistical analysis conducted on geographies consisting of 118,297,106 people shows a mild negative correlation between the proportion of Seminole and labor force participation rate among population between the ages 45 and 54 in the United States with a correlation coefficient (R) of -0.359 and weighted average of 78.1%. Similarly, the statistical analysis conducted on geographies consisting of 118,730,775 people shows a slight negative correlation between the proportion of Immigrants from Uzbekistan and labor force participation rate among population between the ages 45 and 54 in the United States with a correlation coefficient (R) of -0.085 and weighted average of 82.3%, a difference of 5.3%.
In Labor Force | Age 45-54 Correlation Summary
| Measurement | Seminole | Immigrants from Uzbekistan |
| Minimum | 17.5% | 63.0% |
| Maximum | 100.0% | 100.0% |
| Range | 82.5% | 37.0% |
| Mean | 72.2% | 82.4% |
| Median | 74.7% | 83.5% |
| Interquartile 25% (IQ1) | 65.9% | 80.0% |
| Interquartile 75% (IQ3) | 80.4% | 86.5% |
| Interquartile Range (IQR) | 14.5% | 6.5% |
| Standard Deviation (Sample) | 15.5% | 7.1% |
| Standard Deviation (Population) | 15.4% | 7.1% |
Similar Demographics by In Labor Force | Age 45-54
Demographics Similar to Seminole by In Labor Force | Age 45-54
In terms of in labor force | age 45-54, the demographic groups most similar to Seminole are Cajun (78.1%, a difference of 0.0%), Choctaw (78.2%, a difference of 0.050%), Dutch West Indian (78.2%, a difference of 0.14%), Kiowa (78.3%, a difference of 0.16%), and Sioux (78.0%, a difference of 0.23%).
| Demographics | Rating | Rank | In Labor Force | Age 45-54 |
| Cherokee | 0.0 /100 | #319 | Tragic 79.0% |
| Yaqui | 0.0 /100 | #320 | Tragic 78.9% |
| Yup'ik | 0.0 /100 | #321 | Tragic 78.6% |
| Crow | 0.0 /100 | #322 | Tragic 78.3% |
| Kiowa | 0.0 /100 | #323 | Tragic 78.3% |
| Dutch West Indians | 0.0 /100 | #324 | Tragic 78.2% |
| Choctaw | 0.0 /100 | #325 | Tragic 78.2% |
| Seminole | 0.0 /100 | #326 | Tragic 78.1% |
| Cajuns | 0.0 /100 | #327 | Tragic 78.1% |
| Sioux | 0.0 /100 | #328 | Tragic 78.0% |
| Creek | 0.0 /100 | #329 | Tragic 77.7% |
| Cheyenne | 0.0 /100 | #330 | Tragic 77.6% |
| Tsimshian | 0.0 /100 | #331 | Tragic 77.4% |
| Menominee | 0.0 /100 | #332 | Tragic 77.4% |
| Natives/Alaskans | 0.0 /100 | #333 | Tragic 77.1% |
Demographics Similar to Immigrants from Uzbekistan by In Labor Force | Age 45-54
In terms of in labor force | age 45-54, the demographic groups most similar to Immigrants from Uzbekistan are Immigrants from Panama (82.2%, a difference of 0.010%), Iraqi (82.2%, a difference of 0.010%), Ecuadorian (82.3%, a difference of 0.020%), Scottish (82.2%, a difference of 0.020%), and Immigrants from Syria (82.3%, a difference of 0.030%).
| Demographics | Rating | Rank | In Labor Force | Age 45-54 |
| Welsh | 9.2 /100 | #206 | Tragic 82.3% |
| Immigrants | Cabo Verde | 8.6 /100 | #207 | Tragic 82.3% |
| Native Hawaiians | 8.5 /100 | #208 | Tragic 82.3% |
| Immigrants | Lebanon | 7.4 /100 | #209 | Tragic 82.3% |
| Immigrants | Bahamas | 7.1 /100 | #210 | Tragic 82.3% |
| Immigrants | Syria | 6.6 /100 | #211 | Tragic 82.3% |
| Ecuadorians | 6.3 /100 | #212 | Tragic 82.3% |
| Immigrants | Uzbekistan | 5.8 /100 | #213 | Tragic 82.3% |
| Immigrants | Panama | 5.6 /100 | #214 | Tragic 82.2% |
| Iraqis | 5.6 /100 | #215 | Tragic 82.2% |
| Scottish | 5.3 /100 | #216 | Tragic 82.2% |
| Portuguese | 4.7 /100 | #217 | Tragic 82.2% |
| English | 4.4 /100 | #218 | Tragic 82.2% |
| French | 4.1 /100 | #219 | Tragic 82.2% |
| Bahamians | 3.6 /100 | #220 | Tragic 82.2% |